Whatever tears one may shed, in the end one always blows one’s nose.
Heiner Flassbeck and Costas Lapavitsas have extended their discussion of my earlier essays on the fundamental economics of the Eurozone crisis (1, 2 & 3);. This time their focus is my rejection of their claim that “capital flows, credit and banks were not the primary causes of the crisis; that honor belongs to divergences in [labor cost] competitiveness.” I feel this second response is not helping their cause. They continue to talk past the empirical realities, in particular the econometric findings discussed in in my earlier note, that so overwhelmingly contradict their claims. I would like to try one more time to point out what is missing in Flassbeck and Lapavitsas’ analysis, but will try to avoid repeating myself.
But before going into the much more substantive issues, permit me to clarify what is and what is not neoclassical—an issue to which Flassbeck and Lapavitsas devote their Section 2. For me, a model assuming factor price equalization (which in turn needs competitive markets), an equilibrium exchange rate (determined on the current account of the balance of payments only), and strong relative cost- and price-responsiveness of exports as well as imports, and showing a complete disregard for (aggregate) demand as a determinant of trade imbalances as well as for wages as a source of demand, is neoclassical. It would be a Umwertung aller Werte to label it as “Keynesian”. It is not even Ersatz Keynesianism. I now turn to the substance.
The Empirical Evidence Tells a Very Different Story
The most easily stated problem with Flassbeck and Lapavitsas’s narrative is that there is no substantive empirical evidence to back it up. Both authors (as various others) generally resort to graphics (as in their charts 1, 2 and 3) as if these visualizations offer conclusive proof. Unfortunately, visualizations can be tricky and deceptive, suggesting spurious associations—and this is where statistics and econometrics come in handy. Let us elaborate this point and consider Figure 1, which charts the evolution of Spain’s exports and imports (in real terms) and Spanish relative unit labor costs (RULC). What strikes one most is that import growth began to accelerate (sometime around 2003Q1) while export growth and RULC growth kept steady. Now with strong priors (concerning the deleterious impact of higher RULC on export and import growth) and taking the visualization at face value, one could think that the sustained increase in Spanish RULC—supposedly reflecting a prolonged deterioration in the overall cost competitiveness of Spanish firms—must be a major “cause” of the acceleration in Spain’s import growth. And if that is so, higher RULC must have hurt Spanish exporters as well; the impact ought to be symmetric after all.
As it turns out, this interpretation is wrong. Table 1 presents the estimated export and import demand functions for Spain (1999Q1 – 2007Q4) using the data of Figure 1. I have added Spanish real GDP as a determinant of imports and the volume of total OECD exports as a determinant of exports; the functions are expressed in logarithmic form. The findings can be summarized as follows. First, there is no statistically significant association between Spain’s exports and RULC. However, world demand (proxied by OECD exports) does have a statistically significant impact on Spain’s exports; according to my result, growth in world demand statistically “explains” 87 per cent of the growth of Spanish exports—which was not damaged by higher Spanish unit labor costs.
FIGURE 1 Spain: Export Volume, Import Volume and RULC (1999Q1 – 2007Q4)
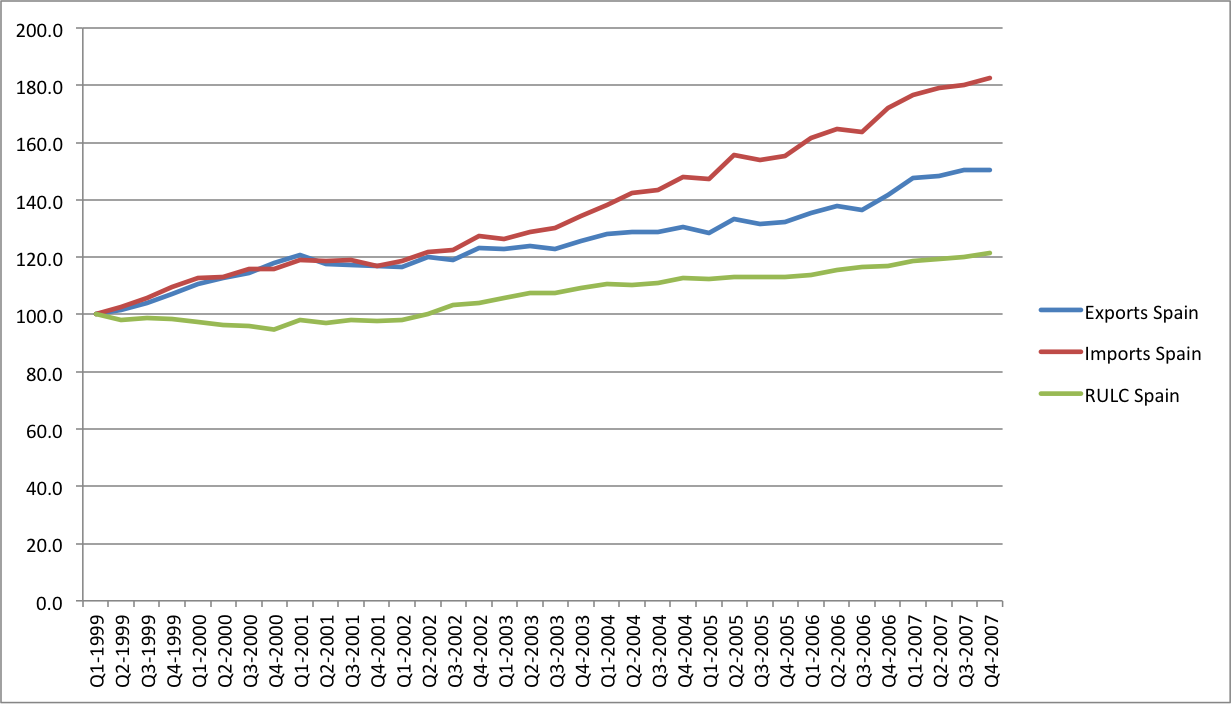
Notes: RULC = relative unit labor cost. The data source is OECD National Accounts Statistics.
TABLE 1 Export and Import Functions Estimated for Spain (1999Q1 – 2007Q4)
|
ln export volume = |
1.21 + 0.67 ln OECD export demand + 0.15 ln RULC (2.39)** (7.13)*** (0.92) |
|
N = 36 quarters (1999Q1 – 2007Q4) R2 = 0.99; F (2, 33) = 72.9***; DW-statistic (transformed) = 2.21 |
|
|
ln import volume = |
-3.84 + 1.61 ln real GDP of Spain + 0.32 ln RULC (-8.98)*** (14.33)*** (2.08)** |
|
N = 36 quarters (1999Q1 – 2007Q4) R2 = 0.99; F (2, 33) = 388.6***; DW-statistic (transformed) = 2.37 |
Notes: RULC = relative unit labor cost. The functions were estimated using the Prais-Winsten regressor (which corrects for AR(1)).
The data source is OECD National Accounts Statistics.
Secondly, there is a statistically significant relationship between Spain’s import growth and Spanish RULC—which may appear to partly vindicate Flassbeck and Lapavitsas’s claim. But on closer look, it doesn’t. The reason is that statistical significance does not automatically imply economic importance. During 1999Q1 and 2007Q4, Spain’s import volume increased by almost 83 percentage points, whereas Spanish RULC increased by 21 percentage points. If I use the estimated coefficient (of 0.32), I find that only a meagre 8% of Spain’s import growth can be attributed to the RULC. This is peanuts, especially when compared to the overwhelming importance for imports of Spain’s real GDP growth, which explains 88% of the accelerated import growth of Spain. While I don’t claim that these findings (in Table 1) constitute the final word on the issue, I do want to stress the point that this is the kind of contradictory econometric evidence that Flassbeck and Lapavitsas never confront.
Let me finally and again highlight the econometric evidence that falsifies Flassbeck and Lapavitsas’ main (and only) claim. Firstly, unit labor costs in the crisis countries started to increase only following a preceding deterioration in their trade accounts (Diaz Sanchez and Varoudakis 2013; Gabrisch and Staehr 2014). Professor Hubert Gabrisch (2015, p. 19) sums up his findings as follows: “In all test versions, we find that an appreciation of the real exchange rate, which is indicated either by relative unit labor costs or by the inflation differential, statistically follows a net inflow of capital and not vice versa.” This means that rising unit labor costs were the consequence, rather than the cause, of the growing imbalances. It is difficult to see it otherwise. The “RULC changes as a cause of trade imbalance” hypothesis has therefore been falsified.
Secondly, based on careful econometric analysis, Paolo Pasimeni (2015) finds that the contribution of RULC changes to Germany’s growing net export surplus are all but negligible—explaining around 2-3% of the actual change in Germany’s trade surplus. This almost exactly confirms earlier findings for Germany by Danninger and Joutz (2007) as well as more recent findings by Detzer and Hein (2014). These findings speak volumes against Flassbeck and Lapavitsas and their silence is remarkable.
Thirdly, I would encourage Flassbeck and Lapavitsas to justify their choice of RULC as the “real exchange rate”. This is not a trivial issue, as should be clear from the careful conceptual critiques of RULC as real exchange rate by Gaulier and Vicard (2012), Felipe and Kumar (2011) and Wyplosz (2013). For example, in the Euro-countries, RULC increased most in the non-tradables sectors, as is shown by Gaulier and Vicard (2012), who argue that this is the symptom of a demand shock rather than a cost-competitiveness shock. For another, in a comprehensive decomposition analysis, Wyplosz (2013) finds that the impact of the appreciation of the Euro (relative to currencies of non-Euro countries) had by far a bigger negative impact on Eurozone competitiveness than increases (or decreases) in RULC. Wyplosz (2013) concludes that “the popular view about the Euro Area crisis is a myth unsubstantiated by the available evidence. The crisis was driven by excessive domestic demand, not by exogenous losses in competitiveness and current account deficits.” The lesson is clear: Flassbeck and Lapavitsas fail to understand that wages are overwhelmingly more important as a source of demand than as an item of cost.
There’s More to the Picture Than Meets the Eye
Flassbeck and Lapavitsas do provide empirical evidence on the close correlation between ULC growth and inflation in a single country in their Chart 1. They are quite fond of this chart, which also makes an appearance in some of their earlier publications. However, unlike what Flassbeck and Lapavitsas appear to suggest, the evidence provided by Chart 1 is fully consistent with my argument that German wage moderation (bringing down ULC growth) contributed to low German inflation, helped by much higher household and corporate-sector savings following the crash in tech stock values on the Neuer Markt in 2000 (Koo 2012). Wage moderation slowed down German growth—and the combination of lackluster growth and low inflation in Germany prompted the ECB to reduce the interest rate for the Eurozone as a whole.
The low interest rate was undeniably out-of-sync with inflation levels in Southern Europe (Lee and Crowley 2009; Nechio 2011; O’Connell 2015). Cheap credit in the South created unsustainable asset bubbles and facilitated untenable debt accumulation, which fed into higher growth, lower unemployment and higher wages. Through higher imports, the debt-led acceleration of growth spilled over into growing trade deficits. Southern European and Germany’s imbalances were overwhelmingly driven by (relative) demand growth. Empirical evidence for Spain is provided in Table 1. The income elasticity of import demand of Spain is 1.61, which means that if Spain’s real GDP grows by 1%, its import volume will grow by as much as 1.61%. At the same time, the income elasticity of Spain’s export demand takes a value of only 0.67, which means that Spain’s exports tend to grow more slowly than world exports. It does not require a Ph. D. in Economics to see that Spain is struggling with a structural trade deficit—if Spain’s GDP grows at the same rate as that of the world, its imports will grow faster than its exports. In this light, Flassbeck and Lapavitsas’ conclusion that “Storm’s emphasis on expenditure switching and the role of aggregate demand are largely irrelevant digressions ….” is just baffling.
Chart 1 is somewhat suspect in one major respect however. What strikes one at first sight is that the sample of countries is a mixed bag—it includes Eurozone members Austria, Belgium, France, Germany, Italy, the Netherlands, and Spain—as well as the EU-12 as a whole (which basically duplicates the seven countries already mentioned) and then the UK, the USA and Japan. Most growth rates in the chart have been calculated for the period 1970-2013. But for Germany Flassbeck and Lapavitsas include separate figures for West-Germany (1970-1990) and “Unified Germany” (1991-2013). It is clear from their Chart 1 that “Unified Germany” finds itself alone at the extreme bottom left, which means that it has had the lowest ULC growth as well as lowest inflation of the whole sample of countries. Italy and Spain, in contrast, find themselves in the extreme upper right corner, as they experienced whopping ULC growth and inflation of around 7% on average per year—compared to a meagre 1.1-1.5% per year in Germany.
Such visual inspection of their Chart 1 emboldens Flassbeck and Lapavitsas to conclude that “there could be no reasonable doubt that Germany has been delinquent due to extraordinary wage restraint.” I beg to differ however—for the simple reason that the statement is palpably untrue. The point is: when comparing, one should do it correctly. That is, ULC growth in “Unified Germany” (1991-2013) should be compared to ULC in the rest of the sample in exactly the same period 1991-2013. Comparing ULC growth in “Unified Germany” (1991-2013) with ULC growth ins Italy and Spain (1970-2013) is like comparing apples and pears—it’s unfair, as we all know that ULC growth in the 1970s and even the 1980s was much higher everywhere than ULC growth in the years after 1991. Table 2 corrects for this bias and presents consistent evidence for just the years 1991-2013 (note that the Ameco data on total number of hours worked for Austria and the EU-12 only start from 1995; hence the growth rates for Austria and the EU-12 are for 1995-2013).
I think a careful assessment of Table 2 is that Germany’s ULC growth is quite close to the sample average—slightly below—but the difference is no reason for getting excited. What is more, Germany’s hourly nominal wage growth (during 1991-2013) is 2.62% per year and also very close to the (unweighted) sample average of 2.79% per annum. Spanish and Italian nominal wage growth rates stand at 3.48% per year and 2.97% per year, respectively, which (again) is quite similar to that of Germany. Hence, using exactly the same sample as Flassbeck and Lapavitsas, there is no reason whatsoever to accept their conclusion that Germany has been delinquent due to extraordinary wage restraint. Far from it: rather than being extraordinary, Germany has been just the average Joe. In my view, if Flassbeck and Lapavitsas want to continue using their Chart 1, it will be useful to include a warning for the reader: “Careful. This visualization is misleading.”
TABLE 2 Inflation, ULC growth, hourly labour productivity growth and hourly nominal wage growth (1991—2013)
|
Growth of GDP deflator |
ULC growth |
Hourly labour productivity growth |
Nominal hourly wage growth |
|
|
EA12 (initial year = 1995) |
1.58 |
1.52 |
1.09 |
2.61 |
|
Belgium |
1.85 |
1.81 |
1.20 |
3.01 |
|
Germany |
1.38 |
1.14 |
1.48 |
2.62 |
|
Spain |
2.94 |
2.43 |
1.04 |
3.48 |
|
France |
1.42 |
1.41 |
1.49 |
2.90 |
|
Italy |
2.59 |
2.22 |
0.75 |
2.97 |
|
Netherlands |
1.98 |
1.88 |
1.07 |
2.95 |
|
Austria (initial year = 1995) |
1.51 |
1.12 |
1.44 |
2.56 |
|
UK |
2.39 |
2.16 |
1.71 |
3.87 |
|
USA |
2.01 |
1.66 |
1.73 |
3.39 |
|
Japan |
-0.80 |
-1.28 |
1.58 |
0.29 |
|
sample average growth rate: |
1.71 |
1.46 |
1.33 |
2.79 |
Note: calculated from AMECO database.
Germany’s Productivity in Comparative Terms
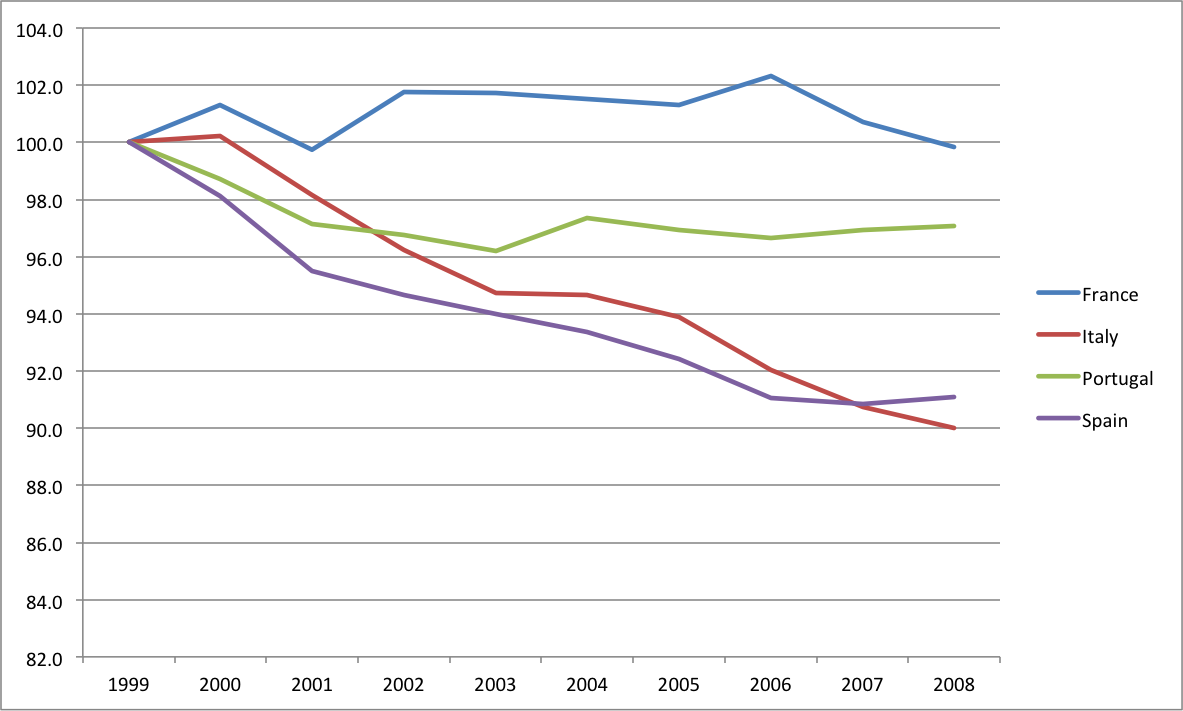
I will leave aside a discussion of Flassbeck and Lapitvisas’ peripatetic account of why (or why not) firms will reduce prices in response to nominal wage moderation, until the moment they provide some serious evidence to back it up. As it is, theirs is only a Just-So story—not unlike Rudyard Kipling’s story “How the Camel Got His Hump.” More importantly, Flassbeck and Lapavitsas try to persuade us of their view that there has absolutely not been a German “productivity miracle.” When they use the word “miracle” they are misrepresenting what I have said, because I did not speak of anything miraculous, but rather only of Germany’s productivity growth being strong and superior to that the rest of the Eurozone (on average). Now, to de-sanctify “miraculous” German productivity growth, Flassbeck and Lapavitsas compare it to productivity growth in Japan, the U.S. and the U.K.—all economies outside the Eurozone. They then single out France (“the decisive comparison”) to reinforce the point that there has been nothing outstanding about Germany’s productivity performance. This amounts to cherry-picking, since France is not generally included in the group of most severely crisis-struck Eurozone countries. They don’t mention Italy, which features in their Chart and the relative productivity performance of which has been nothing but dismal (see also my Table 2). However, based on a more appropriate comparison of hourly labor productivity of Germany with productivity in France, Italy, Portugal and Spain during the pre-crisis common currency years 1999-2008 (as in Figure 2), it is difficult not to observe widening gaps: labor productivity in Italy and Spain declined by more than 9 percentage points relative to Germany’s, and in Portugal by more than 3 percentage points. Southern Europe was losing out in terms of relative hourly productivity compared to Germany—which is exactly my point.
If we go beyond the Figure and zoom in on hourly labor productivity in manufacturing (arguably Germany’s principal export sector), Spanish productivity declined by 6% relative to German manufacturing productivity, while Italy’s declined by 18.5% and relative Greek productivity by 12%. These are by no means small changes in only eight years: it suggest structural divergence, Big Time. In this light, it should be clear that a focus on just relative wages is missing a major part of the action as it concerns RULC. Mind you, not that RULC matter much for exports, imports and trade balances, but just to set the record straight.
FIGURE 2 Hourly Productivity Change Relative to Germany: Total Economy (1999-2007)
Banks Play Only Second Fiddle
Flassbeck and Lapavitsas insist that they have not in the slightest ignored the role of capital flows and banks in the Eurozone crisis in their earlier work. This is true—but in their first INET comment the words “banks” and “finance” are noticeable only for their absence. This time they go at great lengths describing financial flows, to finally conclude that the importance of the credit explosion in the peripheral countries “lay in masking the deleterious impact of the loss of competitiveness by creating a false sense of prosperity and giving the impression that the traditional concerns about current account deficits belonged to the past.” They are so convinced that “Storm is quite simply wrong in both theory and empirical substantiation”, that they do not feel any need to actually engage with the theoretical and empirical critiques—leave alone provide a modicum of empirical evidence in support of their claim.
This is not just disappointing; it is also difficult to react to. Let me just repeat that the”RULC changes as a cause of trade imbalance” hypothesis has been empirically falsified (Diaz Sanchez and Varoudakis 2013; Gabrisch and Staehr 2014); that there is clear evidence that Germany’s declining RULC does not statistically explain its growing trade surplus (Pasimenti 2015); and that we have every reason to think that the credit explosion in Southern Europe, while home-made, was fueled by the surge in credit “pushed out” from Germany, France and the Netherlands (O’Connell 2015).
Demand
I have consistently argued that ( a) the Eurozone imbalances were driven by differences in the growth rate of domestic demand and incomes (i.e. through the income elasticities of exports and imports); (b) much of the demand growth in the Eurozone periphery was fueled by cheap credit and willing domestic and foreign banks, eager to provide the loans; while (c) ULC competitiveness, applying Occam’s Razor, can conveniently and without further harm, be dropped from the list of proximate causes. Flassbeck and Lapavitsas however stick to their view that the role of aggregate demand is a “largely irrelevant digression” and again do not engage with my argumentation.
Instead, in response to my conclusion that the spillover effects on the Eurozone periphery of higher German wages are very small, they make a volte-face—claiming that the monetary union has failed and is beyond rescue, Greece and Portugal should exit, and perhaps the EMU should be dismantled in an organized manner. What strikes one is (notwithstanding vast ideological differences) a certain congruence of views between the “critical” and the “mainstream”—Professor Sinn, for instance, has also been urging Greece to leave. What both sides of the spectrum do not see is that an exit from the Eurozone (or its complete dismantling) will not solve the structural weaknesses of the crisis economies in terms of non-price competitiveness. This lack of “technological competitiveness” is an inescapable structural problem as it is founded on a specialization in relatively non-dynamic, mid- to low-tech economic activities. And it gets reflected, as is shown by the example of Spain (Table 1), in a structural tendency of import growth outpacing export growth. Exiting the zone will not by itself improve this situation. I have labored this point (see also Felipe and Kumar 2011; Janger et al. 2011; Simonazzi et al. 2013) and won’t repeat.
Accurate Diagnosis and Effective Remedy
Part of my argument is that Germany has come to dominate the Eurozone through its technological “superiority,” based on strong technological capabilities and competences. Redressing the real imbalances in production structures and technological capabilities would require a common investment program and industrial policy for the Eurozone to allow the periphery to catch up. The likelihood of this happening is similar to that of snow in Madrid in August, write Flassbeck and Lapavitsas. They also fear that this claim will be interpreted in Berlin as further evidence to force the periphery to reform, restructure and liberalize to improve its productivity and competitiveness (as is currently happening). This may well be so, but if it is the economic truth (which I think it is), then it should be stated as it is. After all, a patient’s health will not improve by the doctor shying away from what is the real diagnosis. And we must distinguish between diagnosis and remedy—one can agree on the first and sharply disagree on the latter, which is precisely the case here.
If we accept that the periphery has to become stronger in terms of non-price competitiveness and if we agree that there are lessons to be learned from the German experience in this regard, then the key issue is: which lessons should we learn? The wrong lesson is that Germany has been successful because of its low ULC or due to the deregulation of its labor markets (as a result of the Hartz reforms). The right lesson is that German manufacturing strength depends on a regulated, coordinated core in which workers in those industries get high wages, have strong employment protection and good social security (see Storm and Naastepad 2015 for the detailed argument). It would have been utterly impossible for German firms and workers to build up such manufacturing strength under the neoliberal policies and rules that Berlin wants to see imposed on Southern Europe. The Hartz reforms bypassed these “core industries” (for good reasons) and effectively created a secondary low-wage, mini-job, flexible labor market in services. Germany’s manufacturing strength is based on high wages and “rigid” labor relations, not low wages and “flexible” employment conditions! As long as this message is not understood in Germany itself, its leaders keep on exporting the wrong ideas and policies. In this light, Flassbeck and Lapavitsas’ insistence on (low) ULC as the key ingredient of Germany’s export success story is less than helpful, as it just keeps reinforcing these wrong ideas of Messr Sinn and Schäuble.
Finally, after all this friendly fire, we must not forget the fact that Germany is not such a strong economy at all. Germany’s economy grew at a rate of 1.2% per year during 1999-2015, and just 0.8% during 2008-2015—which is hardly a sign of economic health. Its (often very big) banks are bloated and overleveraged, the wage moderation and Hartz reforms have slowed down growth and led to huge increases in wage, income and wealth inequalities, its dynamic and competitive manufacturing sector is not creating but shedding jobs and working hours, and the economic dualism (between a manufacturing core with “protected” workers and a mostly low-wage services sector employing the working poor) within Germany is growing rapidly—faster than anywhere else actually.
Germany can continue to refuse to help reduce the gap between the core and periphery within the Eurozone (thereby causing the EMU to break up), but it cannot escape facing up to growing dualism at home—even though this is what Sigmar Gabriel (2016), Germany’s Vice-Chancellor and the leader of the social democratic party SPD, is trying to do. Gabriel’s shocking call for an even larger “secondary” labor market to provide much-needed employment to the long-term unemployed and the refugees amounts to a de-facto institutionalization of dual workers: those with good jobs in core manufacturing and banking versus those with badly paid, flexible-hours, unprotected jobs in services. This will not bring growth, but just expand the class of the working-poor. The political risks of Gabriel’s Faustian bargain are huge, because the polarization of workers can only lead to a similar erosion of the political middle ground, which directly feeds into the growth of the political extremes. There are clear echoes of Weimar here. If Gabriel gets his way (which I hope will not happen), inequalities will just continue to go up and there will be increasingly similar tensions within Germany itself as between Germany and crisis-struck Southern Europe. The chickens will come home to roost, also in Germany.
REFERENCES
Danninger, S. and F. Joutz. 2007. What explains Germany’s rebounding export market share?, IMF Working Paper WP/07/24. Washington, DC: IMF.
Detzer, D. and E. Hein. 2014. Finance-dominated capitalism in Germany – deep recession and quick recovery. FESSUD Working Paper Series No. 54. Institute for Political Economy. Berlin School of Economics.
Diaz Sanchez, J.L. and A. Varoudakis. 2013. Growth and competitiveness as factors of Eurozone external imbalances. Policy Research Working Paper 6732. Washington, DC: World Bank.
Felipe, J. and U. Kumar. 2011. Unit labor costs in the Eurzone: The competitiveness debate again. Working Paper No. 651. Levy Economics Institute of Bard College.
Gabriel, S. 2016. This year must be the year of integration if we want to solve the refugee crisis. Social Europe February 11. https://www.socialeurope.eu/2016/02/this-year-must-be-the-year-of-integration-if-we-want-to-solve-the-refugee-crisis/
Gabrisch, H. 2015. Cross-border finance, trade imbalances and competitiveness in the euro area. Available at: https://mpra.ub.uni-muenchen.de/68518/
Gabrisch, H. and K. Staehr. 2014. The Euro Plus Pact: cost competitiveness and external capital flows in the EU countries. Working Paper Series No. 1650. Frankfurt: European Central Bank.
Gaulier, G. and V. Vicard. 2012. Current account imbalances in the euro area: competitiveness or demand shock? Banque de France Quarterly Selection of Articles No. 27. Paris: Banque de France.
Janger, J., W. Hölzl, S. Kaniovski, J. Kutsam, M. Peneder, A. Reinstaller, S. Sieber, I. Stadler, and F. Unterlass. 2011. Structural Change and the Competitiveness of EU Member States - Final Report. On-line available at: http://ec.europa.eu/enterprise/policies/ industrial-competitiveness/documents/files/structural_change_en.pdf
Koo, R.C. 2012. Balance sheet recession as the other-half of macroeconomics. Nomura Research Institute Working Paper.
Lee, J. and P.M. Crowley. 2009. Evaluating the stresses from ECB monetary policy in the euro area. Bank of Finland Research Discussion Papers 11-2009. Helsinki: Bank of Finland.
Nechio, F. 2011. Monetary policy when one size does not fit all. FRBSF Economic Letter 2011-18. San Francisco: Federal Reserve Bank of San Francisco.
O’Connell, A. 2015. European crisis: a new tale of center-periphery relations in the world of financial liberalization/globalization? International Journal of Political Economy 44 (1): 174-195.
Rebooting Consensus Authors. 2015. Rebooting the Eurozone: Step 1 – agreeing a crisis narrative. 20 November. Available at: http://www.voxeu.org/article/ez-crisis-consensus-narrative
Schröder, E. 2015. Eurozone imbalances: measuring the contribution of expenditure switching and expenditure volumes 1990-2013. Department of Economics Working Paper 08/2015, The New School for Social Research. Available at: http://www.economicpolicyresearch.org/econ/2015/NSSR_WP_082015.pdf
Simonazzi, A., A. Ginzburg and G. Nocella. 2013. Economic relations between Germany and southern Europe. Cambridge Journal of Economics 37 (3): 653-675.
Storm, S. and C.W.M. Naastepad. 2015. Crisis and Recovery in the German economy: The Real Lessons. Structural Change and Economic Dynamics 32 (1): 11-24.
Wyplosz, C. 2013. Eurozone crisis: it’s about demand, not competitiveness. At: https://www.tcd.ie/Economics/assets/pdf/Not_competitiveness.pdf