Targeted Measures and Subsidies for Cost Effective COVID-19 Abatement
Less than two weeks ago, COVID-19 was spreading in the United States at a rate of 100,000 new cases per day. Now the rate is approaching 180,000 per day and still rising. As new cases have soared, a somber chorus of political leaders, media editorial outlets, and business figures have gravely proclaimed that “lockdowns don’t work” or that “the economic and public health damage from a lockdown are as bad or worse than that inflicted by the virus they are meant to stave off.” [1-8] A careful analysis of data comparing differing national responses leads to clear delineation of what works, and what does not. This paper demonstrates not only that lockdowns do work but indicates what other measures can slow and even suppress the coronavirus, and why. Our study closes with specific recommendations that promise to work better than blanket lockdowns and what nations, states, and even citizens should do to effectively address the pandemic right now.
Lockdowns Work
With over ten months of data from dozens of coronavirus hotspots around the world, statements proclaiming the futility of lockdowns are now provably false. Strict lockdowns do work, and they work swiftly, within 4-6 weeks. They worked not only to suppress, but to virtually eliminate the virus in Australia, New Zealand, and Iceland, as well as in China, Korea, and Taiwan. Figure 1 below tells the story in one picture of new COVID-19 case counts by country.
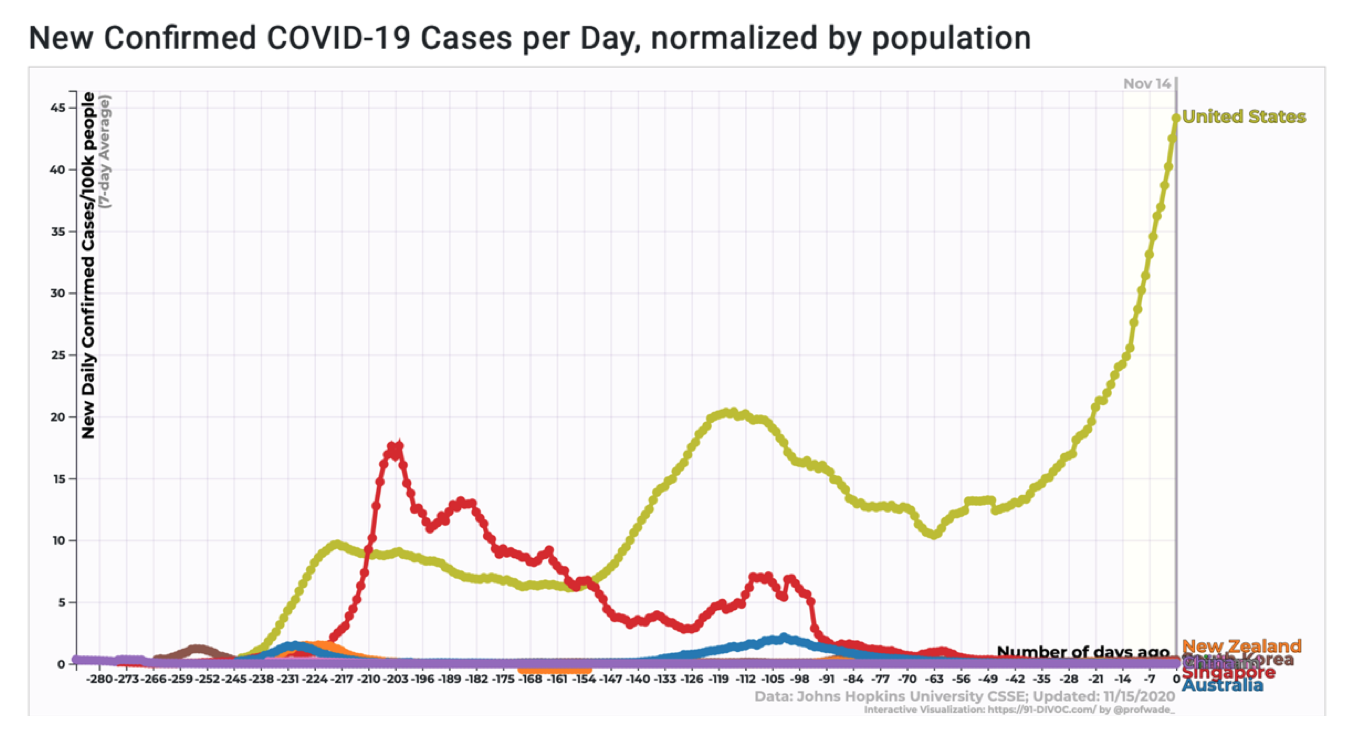
Figure 1. New COVID-19 case count by country normalized by population (7-Day moving average). The time dimension on the X-axis counts backward from left to right along the horizontal axis, starting in February 2020 and ending at November 14, 2020 on the right margin. The vertical axis shows a seven-day moving average of new COVID-19 cases per day. The countries that have effectively managed and suppressed the spread of the Coronavirus all cluster in the bottom right corner of the chart. These include China, Singapore, Taiwan, South Korea, Thailand, Vietnam, Australia, New Zealand, and Iceland.coronavirus
Recommendation #1: Save the Economy by Saving Lives First
Limiting economic damage caused by the pandemic starts and ends with controlling the spread of the virus. Dozens of experiments conducted in different countries across the world definitively show that no country can prevent the economic damage without first addressing the pandemic that causes it. The countries that swiftly focused first on pandemic abatement measures are now reopening in stages and growing their economies. Most of the countries that prioritized bolstering their economies and resisted, limited, or prematurely curtailed interventions to control the pandemic are now facing runaway rates of infection and imminent state and national lockdowns.
If you still believe that a nation can somehow stimulate and recover the economy without first addressing the pandemic — in other words, trade lives lost to COVID-19 for livelihoods that would otherwise be lost through lockdowns — consider the following chart in Figure 2. It plots the number of coronavirus deaths, a measure of the regional severity of the pandemic, versus the total economic loss, including both the decline in GDP (see end notes on data from EuroStat 11 and OECD 12 GDP Data) and the cost of economic stimulus programs drawn from national budgets and assumed debt (as summarized in this IMF report “Fiscal Policies Database in Response to COVID-19”) by country as of the end of Q2 2020. The chart is effectively a rough representation of how well each country has protected its citizens versus the total cost of doing so.
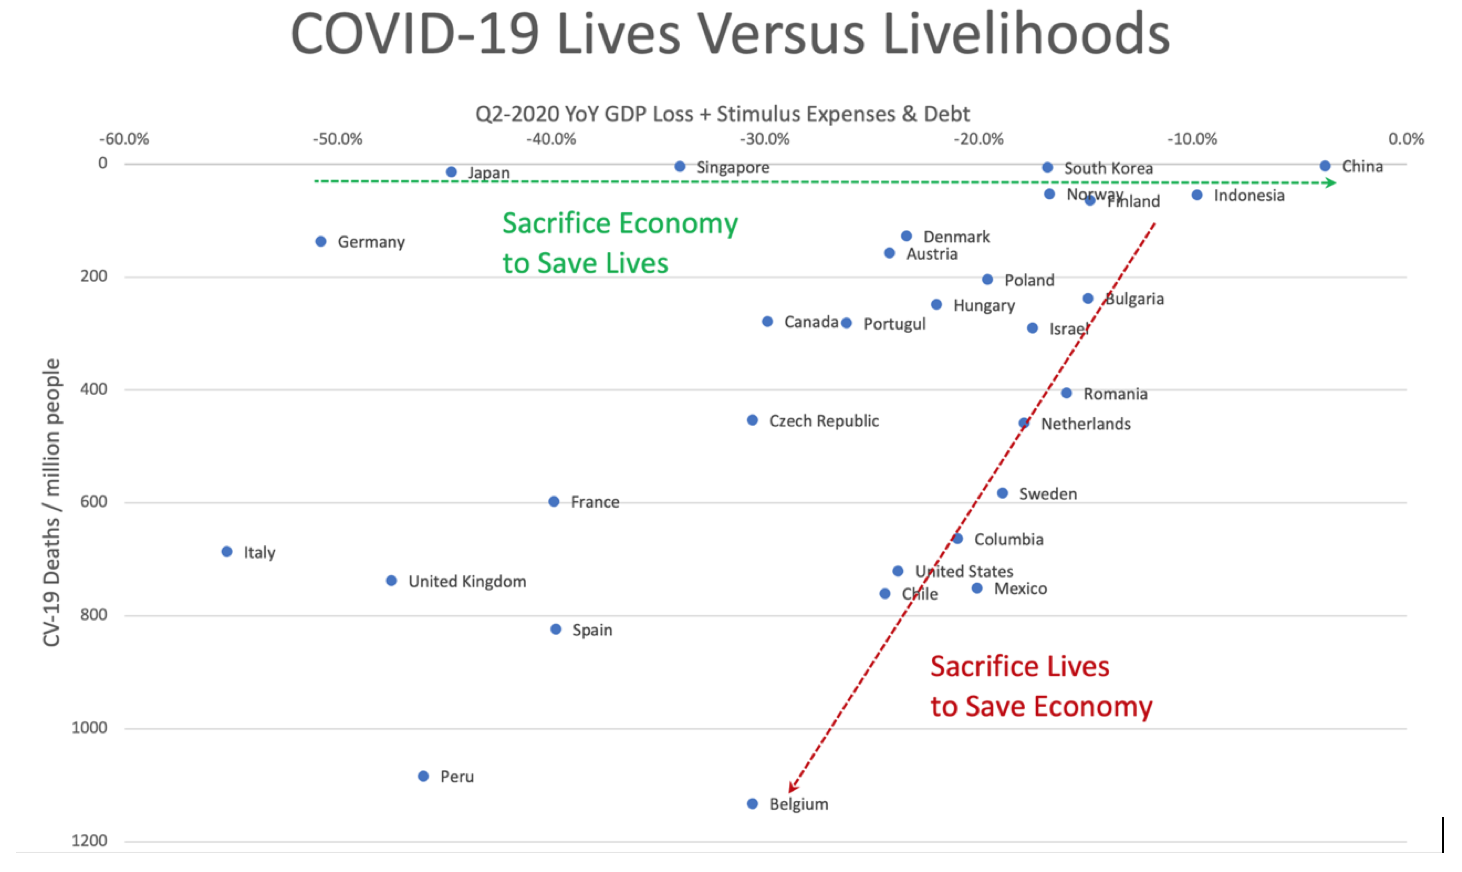
Figure 2. Economic Loss versus the Loss of Lives to COVID-19. This chart draws on IMF economic and stimulus measures against Johns Hopkins COVID-19 data to plot each country’s coronavirus deaths against the total economic loss each suffered (including both the decline in GDP and total spending on economic stimulus programs along with debts and liabilities they took on) as of the end of Q2 2020. The economic losses are shown on the horizontal X-Axis; countries doing better are located towards the right with less loss. The Y-Axis plots the number of deaths per million people, a normalized measure of how bad the pandemic is that controls for different country populations. Countries with fewer deaths, who better protected their citizenry are at the top of the graph.
Once one takes the critical analytical step of estimating all the costs of the pandemic response, including those deferred for future payment, different national response strategies become easily distinguishable. Countries that swiftly focused on coronavirus suppression and elimination, effectively choosing to temporarily sacrifice their economies to limit the coronavirus spread and save lives, show along the top of the chart, highlighted by the green line. Countries that chose to limit pandemic response in favor of economic stimulus in the name of saving their economies at the expense of their citizen’s lives are grouped along the diagonal red line. Those that delayed response or waffled between strategies lie in the middle, like the U.K., suffering the worst of both extremes.
Figure 2 above highlights the clear and consistent limit to how strong any nation’s economy can be that is proportional to the local severity of the pandemic: The worse the pandemic was allowed to get, the more the costs of dealing with it piled up, which directly impacted the overall costs to the economy. No amount of spending to bolster the economy with fiscal or monetary stimulus changed this near-straight line relationship. That realization alone should deter national and state leaders from pursuing primarily economic responses to COVID-19. But an even more damning realization emerges when you consider how the graph changes over time.
Those countries, like the United States, that invested in economic stimulus while allowing the virus to continue proliferating continue to suffer from unabated community transmission, deepening the economic damage quarter after quarter as the virus spreads. Those unhappy economy-over-lives countries in Figure 2 are trapped in a calamitous feedback loop of having to invest more and more to stay on that diagonal limit as the virus grows and their GDP continues to decline. They move down and to the left along the red line, requiring ever-increasing economic stimulus, and allowing more and more people to die of the virus until their medical systems are unable to keep up. At that point, when they are suffering both economic and humanitarian disaster, extreme lockdowns are unavoidable. Take the U.S. case, for example. The US started at the upper right hand corner of the graph, and when early action was somewhat delayed in the first surge in the Northeast, the country traveled downward along the red line until the first national lockdown, after which, once the virus abated from the initial hotspots, it enjoyed a brief economic recovery. But as the virus resurged in the south and west, and now sweeps across the nation with each new resurgence worse than that before, the U.S. faces ongoing self-reinforcing growth in both viral and economic damage.
On the other hand, China, Taiwan, Australia, New Zealand, Iceland, and Singapore, Vietnam and Thailand, which all invested primarily in swift coronavirus suppression have effectively eliminated the virus and are seeing their economies begin to grow again. They are also in a positive feedback loop — in this case, a good one — where the reopening economies grow themselves without additional stimulus and suffer diminishing damage from the virus as cases dwindle. Their natural self-sustaining trend in Figure 2 is travel to the right along the green line towards economic recovery. In the process they saved hundreds of thousands of lives; a clear win-win in both economic and humanitarian terms.
A final useful thought experiment that emerges from the above chart is to use it to evaluate the effectiveness, or the return on investment, of direct investment in pandemic response versus investment in economic stimulus.
The single biggest and most consistent difference between the successful Asian countries and those Western countries that continue to struggle with COVID-19, is universal adoption of high-quality mask wearing and strict adherence to social distancing measures passed, and enforced by, national governments. These governments correctly calculated in advance that the costs of producing and distributing masks for everyone, imposing social distancing, and supporting the poor through short but effective lockdowns would be dwarfed by the longer term economic damage of continuing viral surges and the ongoing stimulus required as long as the virus rages unaddressed.
One need look no further than the U.S. plan to distribute 5 quality masks to every person in the country through the postal service, a plan that was shut down by the Trump administration. (See: “Whitehouse Nixed Plan to Send Facemasks to Every Household In US”) The cost of such a program would have been in the range of $1 billion, relative to the economic stimulus passed at that time in Q2 congruent with the chart data, of $1.7 trillion, a figure which has since grown to over $3 trillion plus ongoing GDP losses. The relative effectiveness of the contrasting measures is likely in the range of 1,000-to-1 in favor of pandemic abatement over economic stimulus. In other words, a billion dollars spent on masks and social distancing could have had a similar economic effect as a trillion-dollar economic stimulus, and it could have saved as many as 200,000 American lives.
The uncomfortable reality is that the pandemic doesn’t respond to political ideology, especially when it flies in the face of nature and reality. Those who resist lockdowns and containment measures early in the wave of infections are not, in fact, avoiding lockdowns. What they are really doing is guaranteeing that the inescapable lockdown will happen regardless, and will have to be more stringent, and for much longer, because they refused more moderate action earlier. (And it will cost more and more, all along the way until the virus is suppressed.) This conclusion follows from the way coronavirus infections ramp up exponentially and taper off much more slowly. All the economy-first boosters are really doing is trading off a few weeks of “freedom” up front for months of extra lockdown on the back-end once the hospitals are overwhelmed and allowing tens of thousands of people to die needlessly in the process.
Doubters should compare the recent trajectories of Belgium and Germany. In the face of the virus resurgence, they both instituted new abatement measures at the same time. But Belgium waited until the prevalence was 10x higher than Germany’s threshold to act. The economic difference? Belgium was forced to completely close the economy, while Germany took much milder measures to decrease maximum meeting sizes and adjust the restaurant capacity limits, but otherwise kept the economy open for business. This same dynamic is playing out across different US states, with California and New York following the faster-acting but milder-measure German approach, and the Dakotas and other Midwestern states following the Belgian strategy through cyclical coronavirus resurgence, overwhelmed hospitals, and ongoing economic ruin. These examples make it obvious that hard lockdowns and their ruinous economic costs are an inevitable result of policy and governance failures to address the pandemic directly and earlier, when milder and less costly solutions could have saved many lives and expenses.
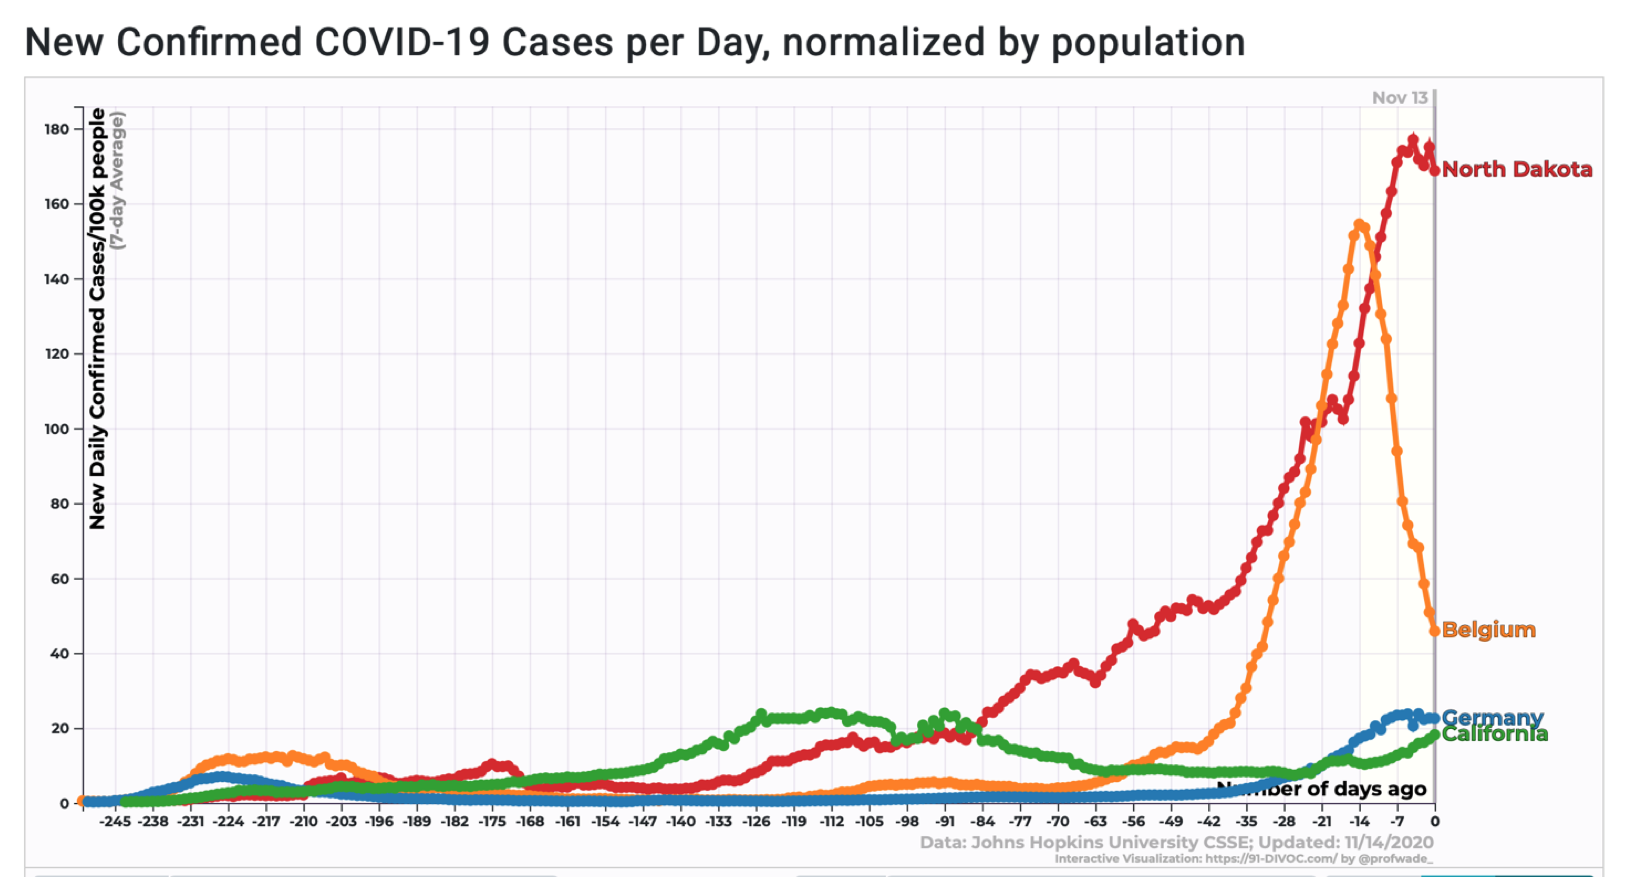
Figure 3. The number of new daily confirmed COVID-19 cases normalized by population for slow actors hoping to stave off lockdowns (Belgium and North Dakota) and swift actors taking milder measures earlier to forestall the need for stricter lockdowns later. The chart clearly shows North Dakota following the Belgian curve, and California tracking to follow the German trajectory.
COVID-19 in the US Now
After ten months of federal inaction and misdirection that has downplayed the virus, encouraged citizens and state leaders to delay any real statewide measures, and even promoted numerous super-spreader events, the virus is out of control across more than half of the states in the US. Our international allies justifiably look on this as a humanitarian disaster that was completely avoidable. Over 200,000 US citizens have died needlessly. We are back to one 9/11 worth of tragic and unnecessary deaths every two days. Doctors Without Borders is sending teams to the overwhelmed US hospital system to help, as if the US was a third world country unable to help itself.
So what now? Most informed observers can probably agree that the national lockdown was a very blunt sledgehammer that, while it did serve the few states like California, Washington, and New York, that were hard-hit early, it also needlessly damaged many states that had yet to see many cases. They can also probably agree that the economic stimulus packages, while they may have kept a few, predominantly medium and large businesses in operation, it did little to nothing for those essential workers most at risk from the virus economically, and kept them not just at risk from the virus, but as active agents in continuing and worsening its spread.
A Better Approach: Use Targeted Abatement and Subsidies
The good news is that we now have much more useful data accessible to us and we can be much more targeted and effective in our response, both in terms of saving lives and saving livelihoods.
Recommendation #2: Ramp-up the Most Cost-Effective Transmission Abatement Measures
David Cutler and Lawrence Summers recently published a paper entitled “The COVID-19 Pandemic and the $16 Trillion Virus,” that estimated the total damage from the COVID-19 pandemic at $16 trillion.[14] By comparison, any measure, even in even the billion-dollar range, that shaves off material percentages of that damage should be pursued on a crash basis. They would pay off around 1,000:1 in forestalled economic damage for every dollar spent. Ramping up the Defense Production Act and leveraging foreign mass production to flood the U.S. market with high quality (K)N95 masks should be at the top of the list. Broad marketing and social media ad campaigns promoting mask usage and social distancing and encouraging citizenship through service in support of public health and the public good would also garner healthy returns on investment, particularly in communities that have been bombarded by conflicted messages from political leaders over the last nine months. Another key category for investment and subsidy is to outfit public transportation, and any essential venue that could host super-spreader events, with improved HVAC systems complete with HEPA filters and increased air flow to limit aerosol transmission. Best practices for room ventilation specify complete air replacement within 6-7 minutes.[16]
Recommendation #3: Geographically Target Measures and Subsidies by Prevalence
We can now use real-time maps of coronavirus prevalence by county, even by zip code, to focus abatement measures only where there is need, assigning levels of targeted and tiered abatement measures by severity of local virus concentrations. Abatement measures that are inexpensive, such as social distancing and mask wearing, should be universal. Abatement aspects that are costly, such as meeting and business capacity limits, ventilation upgrade requirements, and in extreme cases, even mandatory local closures, can be tuned to the local prevalence and only applied as necessary for each region independently, first at super-spreader venues and, only as a last resort, universally. Economic support can also be geographically targeted, channeled directly into the businesses and households in each zip code by level of severity and applied abatement. With such a system, lockdowns only happen in isolated areas where it is most necessary, while everywhere else, milder suppression measures will suffice. Measures are tuned, then, by geography, and local pandemic severity.
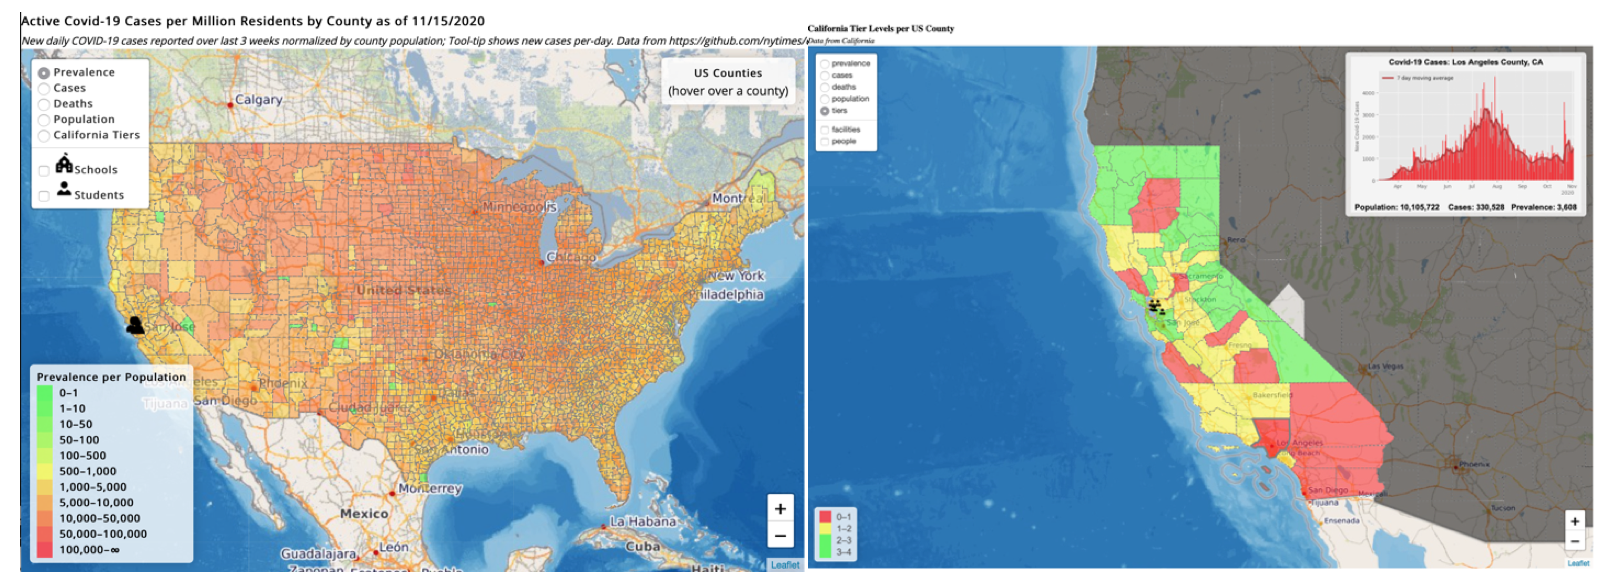
Figure 4. This shows a real-time online COVID-19 Prevalence chart displaying active infection rates by county (left side map), deaths, or even the California Reopening tiers (right hand map) in a zoomable interactive map. Source: http://medio.ai. These tools can be used to automate targeting of both individual and corporate abatement measures and the application of stimulus only where it is most needed and impactful.
Recommendation #4: Subsidize Non-essential Workers to Avoid Working In-Person To be clear, during the more extreme lockdowns in those communities struck by high prevalence, people and businesses should not be paid to continue operating nonessential businesses as before. They should be paid explicitly to avoid working in person in order to avoid spreading the virus. While this might sound expensive and burdensome, the alternative is significantly more so, with even wider and longer lasting lockdowns that can no longer be postponed due to the collapse of health systems and overall public health.
Recommendation #5: Subsidize Essential Worker Conditions, Testing, and Sick Leave Another critically important aspect of pandemic and economic recovery is that truly essential workers, particularly those whose work brings them into contact with many people as part of their services, such as delivery drivers and hospital and grocery store staff, must be supported with subsidized quality PPE, ventilation enhancements, frequent and regular molecular lab testing, and symptom screening to ensure that they are not super-spreaders sustaining the pandemic. They also require leave and healthcare policies that protect them and their families when they succumb to the virus so they have no incentive to hide symptoms and continue working while contagious. This helps curtail the virus, limits company liability, and protects the lives of workers and the public. OSHA and other state employee protection agencies could play a critical role in ensuring the requirement of these protections for essential operations.
Recommendation #6: Speed up Abatement Measure Tuning Using Real Time Data
With the latest COVID-19 testing, case, hospitalization, and mortality data updated daily on a county-by-county basis, analytical tools can expose within a week or two whether current abatement measures are effective. If not, they must be tuned immediately in the enlightened best interest of both public health and the economy. State and county leaders should have access to, and be trained, on how to use these tools. Most importantly, they must learn and apply two critical lessons: once the coronavirus is on an exponential growth trend, unless aggressively curtailed, a catastrophic end and mandatory lockdowns are inevitable; and that the quicker the abatement measure adjustments happen, ideally as soon as a positive exponential growth trend is identified, the milder the necessary measures.
Even the simplest analysis can be immediately helpful. Consider that all one has to do to detect exponential growth in a pandemic case count, is to plot the new cases on the Y-Axis of a graph on a Log scale and look for straight lines. Any time there is a straight line, exponential viral growth is happening, and the more positive the slope, the speedier (and worse) the growth. Using such a tool, it is easy to attribute different measures and events as well as their effects on viral spread, positive or negative, and immediately adjust abatement measures accordingly.
The Dakotas are a prime example of poor pandemic governance in this regard. The pandemic in North Dakota has spread exponentially, since June 6, 2020, yet officials only acted to introduce a mask mandate and business capacity limits on November 12, 2020, more than four months after the inevitable exponential trend was obvious to an even casual observer of data. Now, one can already see within the course of two weeks, curve flattening in response to the earlier suggestions by healthcare professionals to wear masks. But taking up that suggestion alone in November after failing to act for four months, is too little, too late. A flat trajectory, while still at high prevalence, means that the virus will keep spreading at its current rate, continuing to overwhelm local hospitals. More severe abatement measures, including business and school closures, will likely be necessary to suppress the virus and recover a working healthcare system. But note that had a mask mandate been instituted in June, most of this growth in prevalence would have been prevented, and no school or business closures would have been necessary.
South Dakota, however, may just take the crown for worst pandemic governance in the U.S. Despite the growing national pandemic, state officials decided to host a 7,500+ person event at Mt. Rushmore on the 3rd of June, complete with fireworks and attendees from all over the nation. This event, in retrospect, proved to be exactly the super-spreader event that local health officials feared.[10] The state then permitted a second, even more impactful week-long super-spreader event, the Sturgis Motorcycle Rally, which drew 365,979 people from all over the country. Not only did this further accelerate the exponential growth of COVID-19 in South Dakota, it seeded, and accelerated, the pandemic through dozens of neighboring states, likely becoming the primary trigger for the current surge across the mid, and mountain West. A Stanford study calculated the total cost of the event to include over 250,000 new COVID-19 cases across the U.S., over 700 deaths, and a staggering healthcare total expense of over $12.2 billion. [11]
Though the exponential COVID-19 growth accelerated with each trigger, South Dakota leadership resisted taking abatement measures seriously until their hospitals were overwhelmed. And note that even city-posted resolutions at the end of October were sufficient to slow and stabilize the then current prevalence levels of the virus. But again, this minor action, without a mandate, could have saved hundreds of lives and billions of dollars had it been enacted in a timely fashion in June. At this point, it is no longer sufficient to suppress the virus and stop the health and economic damage. South Dakota will be forced to close large parts of its economy to recover.
The effects of each triggering event can be seen at clear inflection points in the charts below within a week of their triggering events, with the exponential growth accelerating at each trigger. Even the blip at the right side of each chart below highlights the pandemic worsening due to the November 3, in-person voting. The need for course correction at each turn was measurable and actionable within a week of each event.
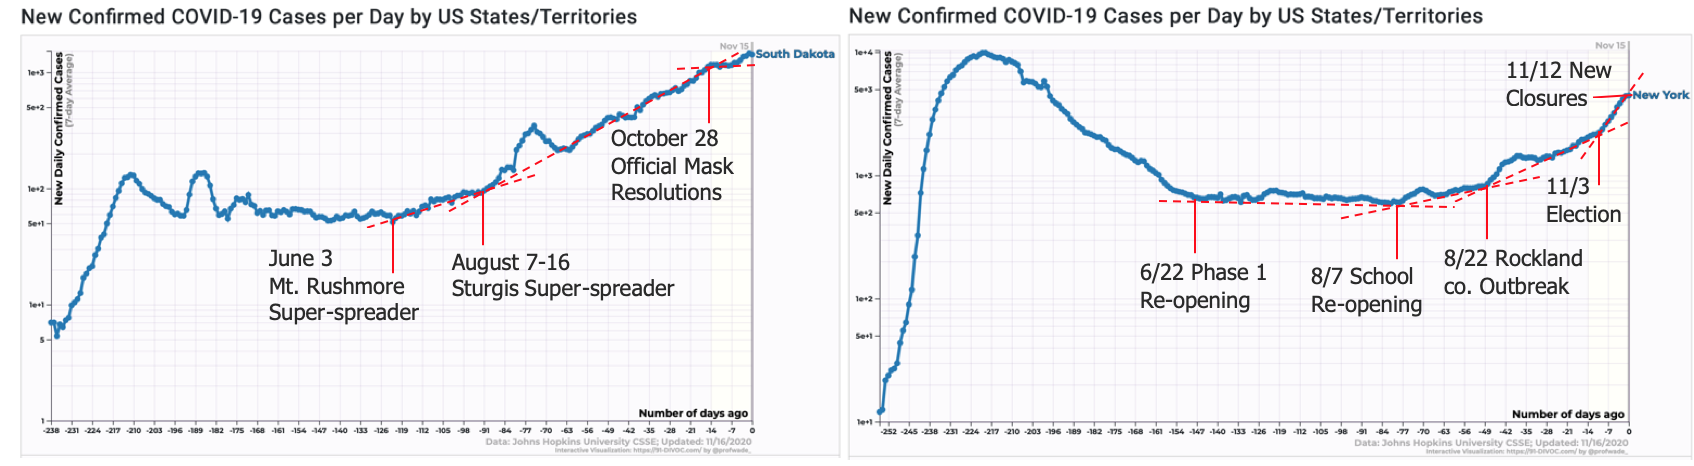
New York and California, on the other hand, are proving much more reactive, tuning measures through gradual re-openings and acting within less than two weeks of a clear exponential trend to re-close open businesses and likely in-person schooling as well. [9] That said, they could have detected within 3 weeks of school re-opening that they were going to have to adjust their measures. Had New York done so sooner rather than later, it might have avoided the additional contagion from school openings that likely facilitated the Rockland County, New York outbreak the following month.
This analysis also makes it very clear which states re-opened schools for in-person learning with insufficient abatement measures and a lack of universal screening test regimens. Florida, Colorado, and Massachusetts are but a few examples of the many states in this category, all of which are experiencing inevitable exponential trends in coronavirus prevalence as a result.
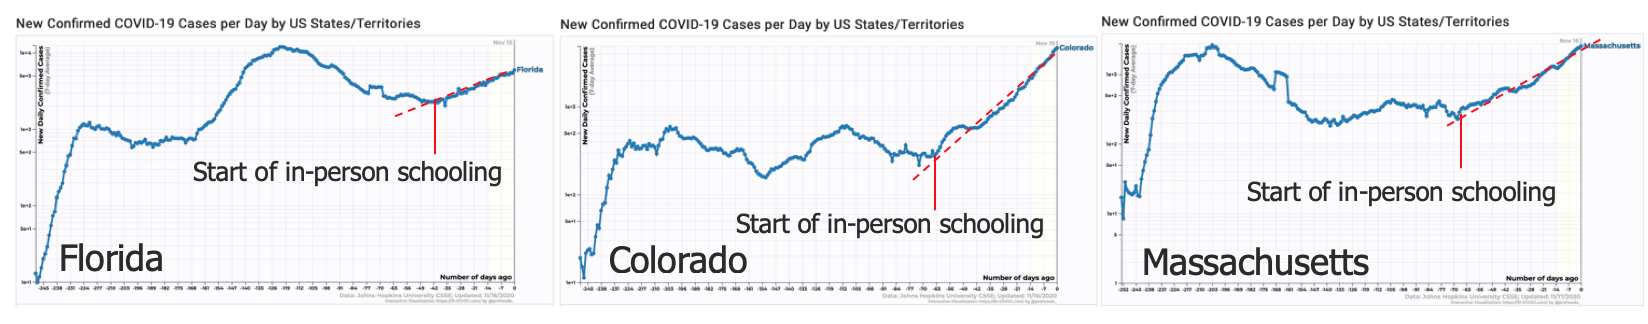
After allowing exponential growth to continue for over a month-and-a-half, they will now likely have to close in-person instruction and reimpose stricter abatement measures and improved testing regimens for their next re-opening after a period of state lockdowns lower the prevalence. With this new approach they could have seen within a week or two whether new measures and processes were working and adjusted accordingly without having had to close the schools.
Recommendation #7: Subsidize Surveillance/Screening Testing and Reporting
A key point, however, is that for the above-described quick-response strategy to be effective, there needs to be a universally available molecular test that is centrally coordinated with testing data immediately forwarded for real-time analysis and direction of measures and stimulus. With this in place, federal, state, and county officials will have the latest possible data on the state of the pandemic so they can effectively govern and respond locally. This requirement highlights a key limitation with most of the point-of-service on-site and single-use disposable tests. None of them will help assist an effective and timely monitoring and analysis of the response effort, an essential key to effective operations under the pandemic.
Best practices now dictate that universal screening tests should be applied to everyone seeking social, business, or school interaction not less than twice per week with not more than 24-hour turn-around times (since people can become infectious within 2.5-3 days of being infected themselves.) This means that tests must be inexpensive enough for everyone at risk of spreading the disease to be tested regularly. Subsidies will almost certainly be necessary to ensure that the economically disadvantaged, who in many cases are more exposed as victims and super-spreader scale carriers, have equal or better testing access than those who offer less risk of infecting others. Even most middle-class citizens can hardly afford the testing at the frequency required. The economic case for making all screening tests free for the duration of the pandemic is compelling, as is the case for free quality (K)N95 mask distribution (as Singapore and Taiwan have done). So too, should the eventual coronavirus vaccine distribution be free to every person.
One of the key early targets for ramped-up testing capability should be school students, faculty, staff, and their families. They should be tested not less than twice per week and using only tests whose results are delivered within 24 hours of the test. In addition to the test frequency requirement described above, another new recommendation is that not only should the students and teachers be tested, but also their families. This is based on the recent CDC report highlighting the high likelihood of household spread[15]; coronavirus transmission within the home occurs with such a high probability that, when calculating the risk of school pods by their size, family members should be included in the pod size calculations and surveillance testing plans. Note that this substantially increases the volume/scale requirements for surveillance testing along with the need for significant cost reduction to make the greater frequency and breadth of testing affordable for schools. Subsidies must be made available to support those schools and communities that cannot otherwise afford complete regimens.
There are three important reasons that suggest this focus on schools. First, a majority of U.S. states have collected case data that definitively shows that the coronavirus prevalence started to ramp up exponentially exactly when in-person classes started in August and September. Note that this is despite a general sparseness of reporting of cases attributed to individual schools. And while there is no specific systemic or irrefutable smoking gun for specific universities, the state data makes it clear that school cases are being under-reported. This aligns with numerous anecdotal reports that school reporting is suppressed “for privacy reasons.” Second, ensuring that children can safely attend in-person classes is a key requirement to free up at least half of America’s K-12 parents to go safely back to work instead of having to remain at home caring for children and managing their remote learning. And third, college students, coming to campus from all over the U.S. and even the world, act as vectors, collecting the coronavirus from wherever it is prevalent, and then seeding new infections as students travel. In that sense, campuses are super-collector as well as super-spreader venues and it is critical to dampen the activity that underpins the exponential spread of the virus.
A comprehensive testing infrastructure should have three tiers of testing: Broad building, campus, and city-scale surveillance testing using waste-water sampling, universal inexpensive individual screening tests, and precision diagnostic tests, all supplying real-time results to official county, state, and federal analytical offices.
Charting the Course Ahead
The next few months will be difficult for the economically focused countries like the US, where too many states allowed COVID-19 to spread unchallenged. At this point the prevalence is high across the entirety of many states. This means that the local divide-and-conquer approach cannot be effective until those broader regions have the coronavirus under better control. Broad regions require a wider scale lockdown for at least a few weeks, and as seen from the data above, the sooner they start, the quicker their recovery should be, at a correspondingly lower cost. The uncomfortable implication is that effective regional measures and lockdowns implicitly require travel limits and quarantines for those in high prevalence areas in what is effectively a divide-and-conquer strategy. Without these travel restrictions, unaddressed local prevalence becomes state, and then national prevalence over the course of a few weeks as infected people spread the virus from regions of high prevalence.
China, Australia, Taiwan, Singapore, South Korea, Vietnam, Thailand, New Zealand, and Iceland all took such measures to bring the coronavirus successfully under control. They used swift response to extensive data, and the national scale-up of testing and tracing along with divide-and-conquer border-control approaches to isolate healthy regions from the virus-ridden. They have all successfully contained and even eliminated the virus domestically and are reopening their economies. The most recent Chinese efforts even focused measures down to the city block scale. The U.S., the U.K. and broader European countries have, so far, failed to respond similarly, and continue to struggle with renewed explosions of exponentially growing community spread. With a coordinated national response that facilitates local focus and swift response to changing coronavirus environments, the US can succeed by following the examples set by successful countries.
In summary, governments should:
1. Suppress the Virus: Prioritize investment in directly stopping the spread of the virus and saving lives first, and de-prioritize inefficient purely economic stimulus. Once the virus is suppressed the economy can then begin to fix itself.
2. Distribute PPE: Immediately ramp up production and distribution to flood the market with free, high-quality N95 and KN95 masks for every American, not just the healthcare workers.
3. Enhance Strategic Communication: Develop and distribute paid advertising from trusted celebrity spokespersons on both sides of the political isle to promote mask wearing, social distancing, virus uptake, and calls for universal support of our country’s social contract and the public good. Even in the multi-billion-dollar investment range, the cost will be negligible, less than 1/1,000th of what would be incurred in economic damage without them.
4. Use Early-warning: Use real-time data-driven analytics systems to drive rapid coronavirus response with early detection of exponential growth in coronavirus prevalence.
5. Divide and Conquer: Geographically target abatement measures when and where the prevalence is worst, and in particular, as soon as exponential growth is identified using the real-time data. This strategy has been successful in China, Taiwan, France, and South Korea.
6. Deliver Targeted Support: Target subsidies to those same geographic areas that specifically suffer shutdown losses from the targeted measures above. Subsidies should be prioritized to protect and compensate essential workers including school students, faculty, staff, and their families so they are not super-spreaders in their continued work, and to pay for other economically disenfranchised people not to work, and stay home, both to avoid further community spread of the virus.
7. Implement Best Practices: Train local governments to use the more sophisticated tools, understand the dashboards, and use them to rapidly respond to changes in the pandemic growth by immediately adjusting abatement measures in response to exponential growth detection.
Those in power where the coronavirus is widespread must act now on the best scientific advice available. But for individuals, waiting for an already delayed government response in the face of an exponentially surging virus is a fool‘s game. Do not wait for governments to act. Lock your family down. Convince your schools to return to remote instruction. Move your church services online. Order food deliveries and take-out. Avoid bars, clubs, gyms, restaurants, and cafes. Convince your friends, neighbors, church, and business colleagues to do the same. Convince everyone to take up masks and social distancing as a public service for the common good.
Do it to save lives. Maybe save a friend, or teacher, or someone you love. Maybe even save yourself.
References
1. Donald L. Luskin, ”The Failed Experiment of Covid Lockdowns,” The Wall Street Journal, https://www.wsj.com/articles/t…
2. Marc Siegel, “Coronavirus lockdowns don’t work,” Fox Business, https://video.foxbusiness.com/v/6209419577001/#sp=show-clips
3. Nigel Farage, “Coronavirus ‘lockdowns don’t work’,” Fox Business, https://sports.yahoo.com/video/coronavirus-lockdowns-don-t-nigel-171950315.html
4. Bradley Byrne, “Business and School Lockdowns Don’t Work,” https://byrne.house.gov/media-center/columns/business-and-school-lockdowns-don-t-work
5. Richard Tice, “”Lockdowns don’t work”: Brexit Party chair on rebranding to be anti-lockdown voice,” LBC, https://www.lbc.co.uk/radio/presenters/nick-ferrari/brexit-party-chair-on-rebranding-to-be-anti-lockdown-voice/
6. Robert Verbruggen, “Lockdowns Don’t Work,” National Review, https://www.nationalreview.com/corner/lockdowns-dont-work/
7. Surjit S Bhalla “Lockdowns don’t work. It remains a mystery as to why the world entered one”, The Indian Express, https://indianexpress.com/article/opinion/columns/lockdowns-dont-work-6855411/
8. “Lockdowns don’t work”, The Critic, https://thecritic.co.uk/lockdowns-dont-work/
9. “COVID-19 pandemic in New York (state) Government Response,” Wikipedia, https://en.wikipedia.org/wiki/COVID-19_pandemic_in_New_York_(state)#Government_response
10. Lisa Kaczke, “South Dakota health experts warn Mount Rushmore fireworks could cause coronavirus spike,” Sioux Falls Argus Leader, https://www.argusleader.com/story/news/politics/2020/06/29/south-dakota-coronavirus-covid-19-mount-rushmore-fireworks-risk-spike/3201337001/
11. Dhaval Dave, Andrew I. Friedson, Drew McNichols, Joseph J. Sabia, “The Contagion Externality of a Superspreading Event: The Sturgis Motorcycle Rally and COVID-19,” http://ftp.iza.org/dp13670.pdf
12. The Eurostat ‘flash estimates’ for GDP, as released in the euroindicators news release (125/2020) on 14 August 2020
13. OECD’s quarterly national accounts data, available at OECD.stat. Data for economic losses by country are much less than perfect. But the IMF and a few other institutions have made attempts to collect the available indicators. As stated at Our World In Data, “In both cases, for References 12 and 13 above, the data relates to the percentage change in GDP compared with the same quarter of the previous year (Q2 2019). This is calculated using a volume measure of GDP and as such, is adjusted to account for inflation between the years. The data is also seasonally adjusted. Note that estimates of GDP are often subject to revision as more data becomes available to national statistical agencies. The pandemic has impacted agencies’ ability to collect information that inform their GDP estimates. Eurostat notes that this is likely to have impacted the quality of the data in some cases (see: https://ec.europa.eu/eurostat/documents/24987/725066/Country_specific_metadata_associated_with_national_estimates_2020Q2)” We would also caution that data on contingent guarantees in particular can be treacherous: many clearly have not been taken up in reality and that total losses on loans, equity injections, and such, will not fully show until after the pandemic ends.
14. David Cutler and Lawrence Summers, “The COVID-19 Pandemic and the $16 Trillion Virus,” JAMA Network, https://jamanetwork.com/journals/jama/fullarticle/2771764
15. Carlos G. Grijalva, Melissa A. Rolfes, Yuwei Zhu, Huong Q. McLean, Kayla E. Hanson, Edward A. Belongia, Natasha B. Halasa, Ahra Kim, Carrie Reed, Alicia M. Fry, H. Keipp Talbot, “Transmission of SARS-COV-2 Infections in Households — Tennessee and Wisconsin, April–September 2020,” https://www.cdc.gov/mmwr/volumes/69/wr/mm6944e1.htm
16. Kimberly A. Prather, Linsey C. Marr, Robert T. Schooley, Melissa A. McDiarmid, Mary E. Wilson, Donald K. Milton, “Airborne transmission of SARS-CoV-2,” https://science.sciencemag.org/content/370/6514/303.2
This paper lists only a few authors who contributed the majority of the writing, but it represents the results of shared data, experiments, analysis, contributions, collected work and tireless discussions, presentations, and brainstorming sessions across a large group of international contributors. They include some of the world’s leading scientists, physicians, epidemiologists, engineers, public health officials, and government leaders across the front lines of the pandemic response, many of whom work on a voluntary basis. This report was improved, in particular, by discussion and comments from Sean Davis, Charles Morefield, David Mussington, and Kim Prather.Regardless, the views expressed represent the personal views of the contributors and do not reflect official policy or position of their respective employers. All errors and omission are the responsibility of the authors.