
The recently published
consensus-narrative on the roots of the crisis of the European Economic and Monetary Union (EMU) have channeled great attention on the search for an appropriate diagnosis and more meaningful analyses, some of which have appeared on this very blog. Peter Bofinger (here and here) has made important contribiutions highlighting the role of coordinated policies of wage moderation adopted in Germany after the monetary unification in increasing the divergences within the EMU — divergences which are now recognised as a key structural weakness of the monetary union. Servaas Storm (here, here, and here), Heiner Flassbeck and Costas Lapavitsas (here and here) have contributed to a thoughtful and detailed debate about the comparative relevance of supply-side versus demand-side processes in determining those imbalances. On the one side, Storm argues that intra-EMU capital flows were the primary cause, because they created the huge demand shock at the origin of the imbalances. On the other side, Flassbeck and Lapavitsas, stress the divergences in unit labour costs (ULC), amplified by Germany’s wage restraint policy, as a key driver of the imbalances.
This column argues that while the demand shock is more synchronised with the development of imbalances, Germany’s wage restraint policy is likely to have amplified divergences in competitiveness. The debate about what came first could in fact be of secondary importance; the primary issue is that the roots of the intra-EMU divergences are to be found in the structural characteristics of its architecture. In other words, and to use the same terminology of the authors of the “consensus narrative,” they are a feature of the system rather than just a bug.
“Features” rather than “bugs”
The EMU suffers from two structural weaknesses: a tendency to develop imbalances, and an inherent deflationary bias. The EMU architecture and its functioning was itself a kind of large, although relatively gradual, asymmetric shock. The imbalances built up during the first decade were a feature of the system, not in the sense that they were a healthy signal of economic integration — as it was misunderstood in the initial years ( Blanchard and Giavazzi, 2002) — but in the sense that they were a natural and perhaps unavoidable consequence of its incomplete architecture.
The establishment of the common currency eliminated the exchange-rate risk, thereby giving way to the largest increase in cross border capital flows ever experienced on the continent. At the same time, though, the important signalling function of the exchange rate was lost ( Tornell and Velasco, 2000) without being replaced by any other common institution. In this case, markets have difficulties in delivering the right signals of imbalances, underreacting or overreacting, and cannot properly correct them (Acocella, 2014).
The single monetary policy for countries with structurally different business cycles also reinforced the incentives to cross-border capital flows. Countries with higher (lower) inflation had lower (higher) real interest rates, and as a restult they attracted (deterred) capital flows from other countries. The more capital flowed into those countries, the more the inflationary pressure rose, in a vicious circle that increased divergences.
This self-reinforcing process represented a huge demand shock in the whole area. Intra-EMU trade imbalances were closely synchronised with demand shocks ( Storm and Naastepad, 2014), and changes in relative cost competitiveness were less significant (Gabrisch and Staehr, 2014; Gaulier and Vicard, 2012). Divergences in unit labour costs, in this sense, were more a consequence rather than a cause of demand shocks, triggered by capital flows.
The case of Germany’s Current Account
The case of Germany is illustrative of the system of intra-EMU transfers operated through financial markets, the so-called “private insurance channel,” and of its impact on the external positions of the participating countries. This is relevant to understanding the role that capital flows and income effects had in sustaining Germany’s current account (CA) surplus vis-à-vis the rest of the EMU, prior to the crisis.
At the inception of the EMU, Germany had a rather balanced external position towards the rest of the area. From 2003 to 2007, it developed an important surplus, whose main sources were France, Italy, Spain, and Austria, and to a less extent also Greece, Portugal, Finland and Slovenia. At the same time, Germany had a deficit towards Benelux countries and Ireland. [1] In 2008, the German surplus towards the EA started decreasing, driven in particular by shrinking demand from Italy and Spain. France and Austria, on the other hand, remained a persistent source of surplus. With the exception of end-2009, Germany’s CA position with Benelux remained on stable deficit throughout the whole period.
Figure 1: Evolution of German Current Account balance towards other EA countries
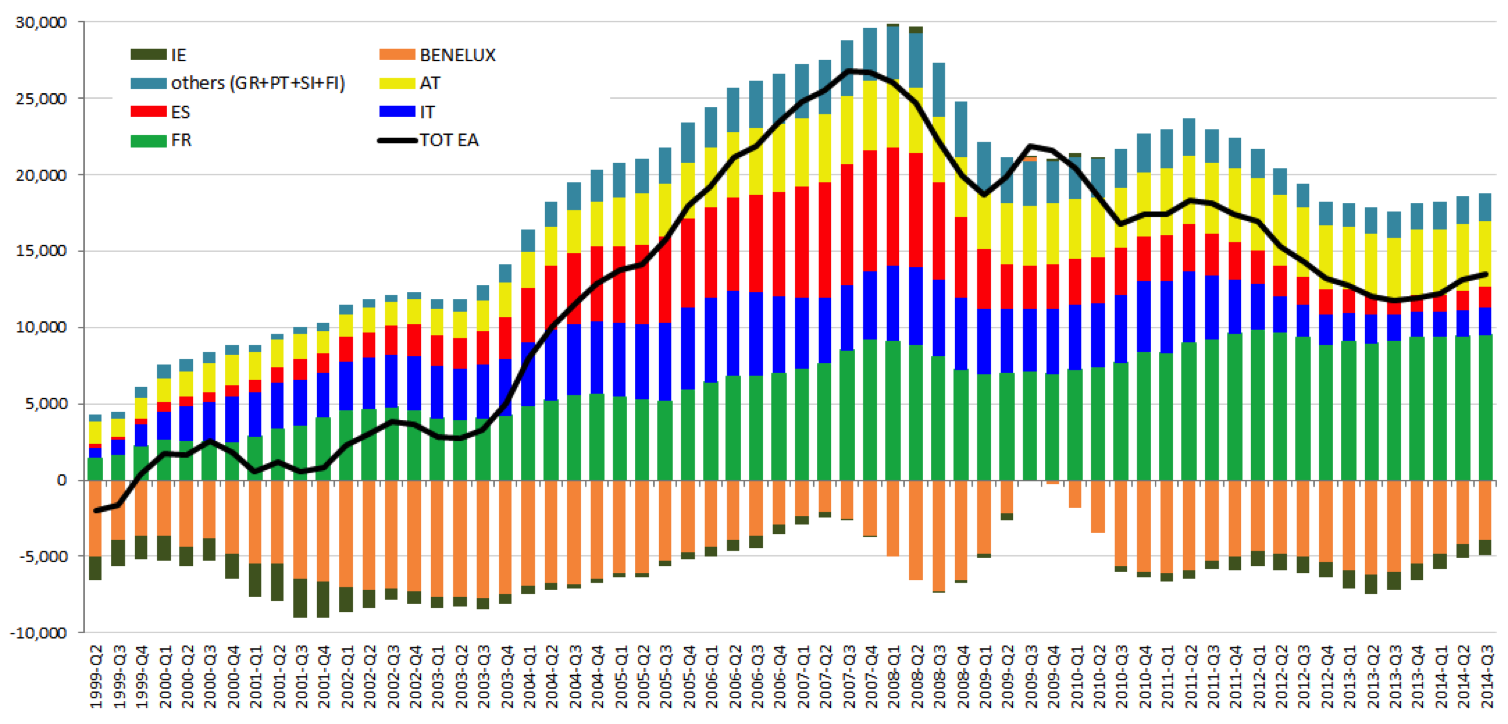
Source: own elaboration on data from the Deutsche Bundesbank.
Germany ran the largest current account surplus in the EA, and its banking sector developed an increasing exposure toward the rest of the currency union. A first, stylized fact is the similar trend of the gross exposure of the German banks and the country’s CA balance with the rest of the Euro Area.
Figure 2: Gross exposure of German banks and German Current Account balance vis-à-vis the rest of the EA (1999-2014, quarterly)
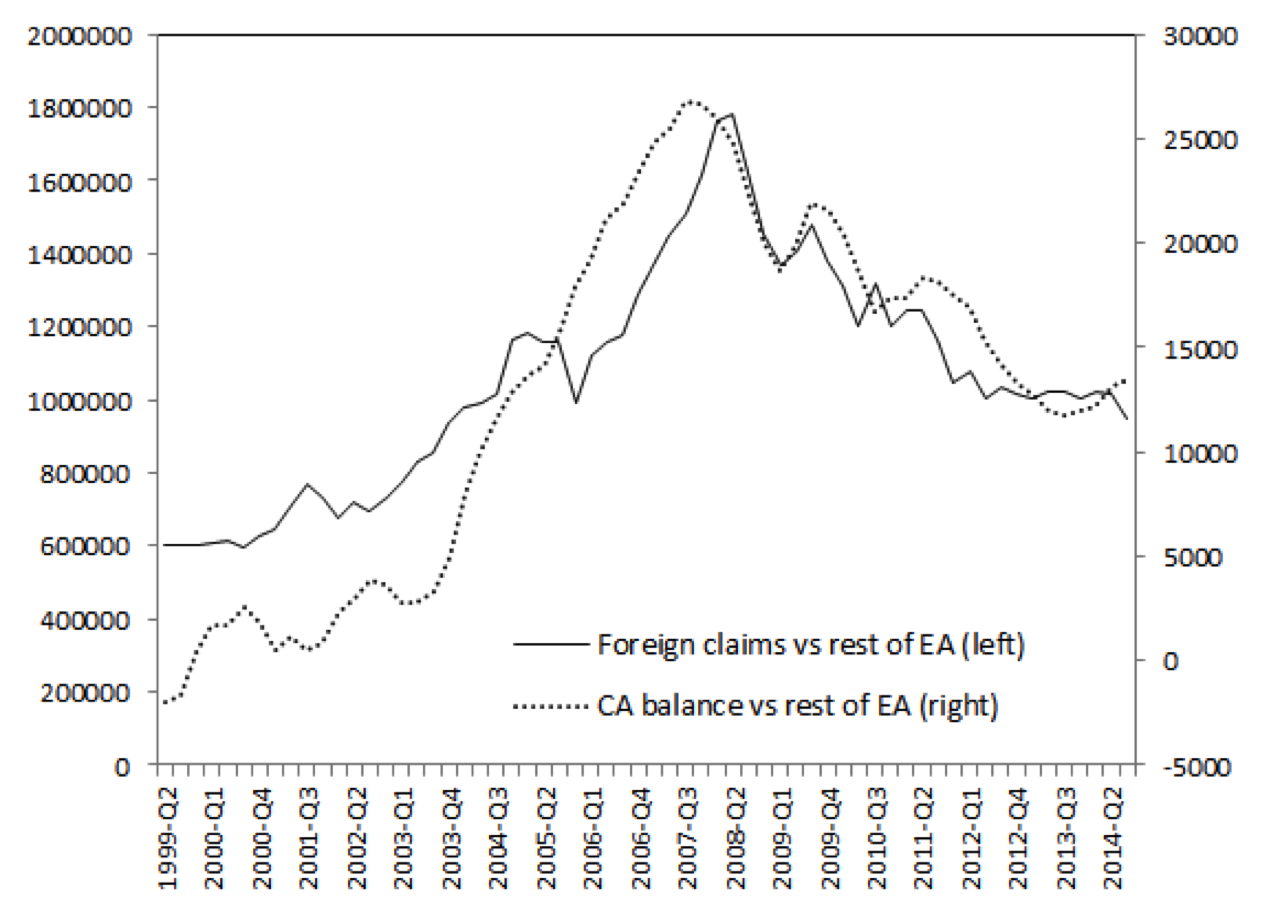
Source: own elaboration on data from the Bank of International Settlements and the Deutsche Bundesbank.
First, the similarity applies not only to the overall position of the country towards the rest of the world, but also holds true for its relation with the Euro Area. Second, and most importantly, the same similarity applies to the bilateral relations between Germany and each other euro area partner.
Changes in relative competitiveness and in domestic demand in Germany and in each other partner can both determine the bilateral current account balances. In a recent paper ( Pasimeni, 2015) I try to better understand the impact of the various factors. The results (see also the annex) show an important and significant effect of the banks’ exposure and of the difference in investments, while real effective exchange rates and interest rates are significant, but with very low coefficients. The exposure of the German banking sector towards each EA country has actually been significantly associated with the German bilateral current account balance (positive and significant coefficients). At the same time, the comparatively lower level of investments made in Germany was the other relevant and significant determinant of the bilateral current account surpluses (negative and significant coefficients). Time-fixed effects suggest that these relations are independent of any specific policy change that might have occurred.
These results confirm the hypothesis that intra-EMU trade imbalances were caused not so much by changes in relative cost competitiveness, but rather by demand shocks and investment in particular. Similar result comes from a study by Danninger and Joutz (2007) on the determinants of Germany’s export performance, which appears to be mainly linked to trade relations with fast growing countries, rather than on improved relative cost competitiveness, which actually “played a comparatively smaller role in explaining the brisk export growth” (less than 2% of German export growth).
Moreover, the significant effect of the banking sector’s exposure on current account balance provides an illustration of the role played by the “private insurance channel.” The larger the capital outflow from Germany to each trading partner, the higher the bilateral surplus, and vice versa. The funds flowing from the German banking sector to other EMU countries, in a context of growing financial integration, boosted aggregated demand in the other countries, and therefore their imports from Germany, in a kind of vendor-financing operation.
Policy implications
If this diagnosis is correct, then, the EMU has a structural tendency towards developing internal imbalances in the current accounts of its members. Absent the exchange-rate, the only way to deal with those is through periodic internal adjustments of income. But pressure to adjust a CA surplus is never as strong as the one to adjust a CA deficit. In fact, the adjustment in recent years has been driven by an important fall in aggregate demand in deficit countries, with large output and employment gaps.
So, if the pressure to adjust is asymmetric, if there are no common instruments for demand management; if the response can only be provided at national level, and if deficit countries can only adjust through deflationary policies, then the whole area has an inherent deflationary bias, which determines subdued growth rates in good times and longer stagnations and recessions in the worst cases.
Table 1: Average annual GDP growth and unemployment rates
|
GDP growth |
Unemployment |
|||
|
1999-2007 |
2008-2014 |
1999-2007 |
2008-2014 |
|
|
World |
4.4 |
3.3 |
- |
- |
|
Euro area |
2.3 |
-0.1 |
8.7 |
10.3 |
|
United States |
2.9 |
1.1 |
5.0 |
7.9 |
|
Other advanced economies* |
3.0 |
1.3 |
5.1 |
5.1 |
|
Emerging market and developing economies |
6.2 |
5.3 |
- |
- |
The EMU faces a cruel trade-off: growth with imbalances, or balance without growth. Either it has to rely on the pre-crisis growth model, when financial integration was substituting a common fiscal capacity, channelling credit and capital flows from surplus to deficit countries, and fuelling unprecedented imbalances. Or, it has to impose restrictive policies, trying to consolidate public finances and achieve balanced external positions, at the cost of a drag on growth. In the worst case scenario, if deflationary policies are prolonged, it may also face the even more unpleasant situation of imbalances without growth. The system lacks an instrument capable of defusing this dangerous mechanism.
The two structural problems of the EMU — the tendency to develop imbalances and the deflationary bias — connect via the balance of payment constraint. Without such constraint, only common fiscal policy can prevent the building up of imbalances, acting as a buffer and providing the adequate fiscal stance over time. Such a fiscal capacity should be linked to the relative, intra-EMU, external balances of the participating countries: The higher the net surplus in intra-EMU trade (that is, the direct benefit from other members’ income), the higher the contribution to a common fiscal capacity.
It is important to stress that the relevant variable is the relative, intra-EMU, current account position and not the absolute one: This way, the composition of the budget can be independent from the overall external position of the euro area, allowing for a form of built-in automatic rebalancing mechanism that guarantees intra-EMU equilibrium, symmetry, and stability.
This idea is not new; it was at the core of John Maynard Keynes’ reflection on a more stable international monetary system (Keynes, 1940). Keynes’ plan for an international clearing union was conceived precisely on the basis of this underlying analysis, in view of the Bretton Woods monetary arrangements. Keynes was concerned with the asymmetric consequences of a mercantilist strategy in a fixed-exchange rate system on effective demand and employment.
The build-up of disequilibria in the balance of payments increases the risk of having to apply deflationary measures in deficit countries to adjust and restore competitiveness. This in turn creates periodic falls in aggregate demand and prevents the system from achieving full-employment.
He proposed an international closed system of payments that, within a system of fixed (but periodically adjustable) exchange rates, ensured symmetric rebalancing between deficit and surplus countries, [2] a kind of “financial disarmament” as he called it (Keynes, 1940). If this plan was too ambitious to be applied at a global level, its relevance is manifest for a smaller but tighter international monetary system such as the EMU.
Some decades later, the 1977 “MacDougall Report” revived the issue, precisely with an eye to the European monetary unification process. It studied how central or federal public finance could reduce inter-regional income differences in eight case studies (Germany, UK, France, Italy, USA, Australia, Canada and Switzerland).
The report measured the public finance outflow/inflow at the regional level in parallel with the relative current account position of each region. It showed that the redistributive function of the national budget at regional level reflected corresponding positions of the regions in their balance of payments on current account. Inflows to relatively poor regions were on average equal to 70% of their current account deficits, while outflows from relatively richer regions were on average equal to 95% of their current account surplus. This achieved an overall stabilisation effect at national level through reducing per capita income differences by 40%.
Had such a scheme been in place in the EMU, it would have automatically reduced the imbalances, periodically and symmetrically correcting them. It would have ensured that surpluses did not remain idle and that absorption of deficits did not pose a drag on aggregate demand. It would have eliminated incentives to “beggar-thy-neighbour” through competitive internal devaluations. It would have been much less pro-cyclical than the system of transfers operated by capital flows in financial markets, which stopped once the financial crisis erupted. It would have also reduced the need for the system to exclusively rely on the efficiency and stability of financial markets, thus reducing systemic risks. It would have provided an instrument for stabilization against common shocks, and it would have substituted the inherent deflationary bias of the system with an adequate demand management, propaedeutic to full employment.
Would such an instrument have avoided the long period of recessions and divergences? This is hard to say, since a proper counterfactual does not exist. What seems clear, however, is that its absence has undermined the stability and prosperity of the monetary union.
This column is based on the paper “The Economic Rationale of a EMU Fiscal Capacity” presented at the Oesterreichische Nationalbank’s workshop “Toward a Genuine Economic and Monetary Union,” September 10 and 11, 2015 - Vienna, Austria. The opinions expressed here are the author’s alone and do not reflect those of the European Commission.
References
Acocella N. (2014),
Signalling imbalances in the EMU, Sapienza University of Rome, Memotef, W.P. 134, November.
Blanchard, O. and F. Giavazzi (2002), “Current Account Deficits in the Euro Area: The End of the Feldstein-Horioka Puzzle,”
Brookings Papers on Economic Activity 2, pp.148-186.
Danninger, S. and Joutz, F (2007) What Explains Germany’s Rebounding Export Market Share?.
IMF Working Papers, 1-49.
European Commission (1977)
Report of the Study Group on the Role of Public Finance in European Integration (MacDougall Report).
Gabrisch, H., Staehr, K. (2014) The Euro Plus Pact: Competitiveness and External Capital Flows in the EU Countries.
ECB Working Paper No.1650.
Gaulier, G. and Vicard, V. (2013) The Signatures of Euro Area Imbalances: Export Performance and the Composition of ULC Growth.
ECB, Compnet Policy Brief 02/2013, July 2013.
Keynes, J. M., Activities 1940-1944, Shaping the Post-War World: The Clearing Union, The Collected Writings of John Maynard Keynes, Royal Economic Society, MacMillan and Cambridge University Press, Vol. XXV, London 1980.
Pasimeni, Paolo (2015)
The Economic Rationale of an EMU Fiscal Capacity. Proceedings of the Oesterreichische Nationalbank Workshop “Towards a Genuine Economic and Monetary Union”. Vienna, September 2015.
Storm, S., & Naastepad, C. W. M. (2014). Europe’s Hunger Games: income distribution, cost competitiveness and crisis.
Cambridge Journal of Economics, beu037.
Tornell, A., & Velasco, A. (2000). Fixed versus flexible exchange rates: Which provides more fiscal discipline?.
Journal of Monetary Economics, 45(2), 399-436.
Annex: Empirical analysis
The dependent variable in the analysis is the bilateral current account balance of Germany vis-á-vis each other partner, expressed in percentage of Germany’s GDP (CA).
A measure of the exposure of the banking sector towards each other country (EXP), can shed some light on the importance this channel had (or not) in determining the bilateral current account positions. This is measured relative to Germany’s GDP.
As a measure of relative competitiveness, we use the real effective exchange rate (RE) based on unit labour costs (ULC), and in particular the difference between the German rate and the one of each trading partner.
In order to capture the change in domestic demand due to investments, we use gross fixed capital formation (GFKF) on GDP, and in particular the difference between this share in Germany and in each trading partner. The sign of the coefficient associated to this factor can tell us if higher (lower) investments where actually leading to deficits or surpluses, between Germany and each other country.
In some specifications, we also include the long term government bond yields (Maastricht definition – average), and in particular the difference between the German rate and the one of the partner. Fj represents country fixed effects, and Ft time fixed effects.
The full specification takes this form:

The detailed results are shown in the following table:
Table 3: Determinants of bilateral Germany's current account balance, 1999-2014, quarterly
|
Dependent variable = CA DEj/GDPDE |
|||||||||||||||
|
(1) |
(2) |
(3) |
(4) |
(5) |
(6) |
(7) |
(8) |
(9) |
(10) |
(11) |
(12) |
(13) |
(14) |
(15) |
|
|
EXPOSURE |
.296*** |
.300 *** |
.301*** |
.306*** |
.344*** |
.201*** |
.179*** |
.162*** |
.128*** |
.127*** |
.228*** |
.175*** |
.191*** |
.209*** |
.208*** |
|
(17.27) |
(17.84) |
(17.03) |
(17.61) |
(19.06) |
(11.68) |
(9.75) |
(9.24) |
(7.22) |
(7.15) |
(13.42) |
(10.92) |
(9.78) |
(11.54) |
(11.50) |
|
|
REER |
-.000 |
-.000 |
-.000* |
.001*** |
-.001*** |
-.001*** |
-.000*** |
.001*** |
.001*** |
||||||
|
(1.06) |
(1.28) |
(2.58) |
(-10.63) |
(-10.56) |
(-9.63) |
(-3.72) |
(3.89) |
(3.99) |
|||||||
|
INVEST |
-.228*** |
-.227*** |
-.380*** |
-.152*** |
-.143*** |
-.185*** |
-.256*** |
-.310*** |
-.346*** |
||||||
|
(-5.64) |
(-5.62) |
(-8.20) |
(-6.97) |
(-7.05) |
(-6.90) |
(-12.65) |
(-12.72) |
(-11.99) |
|||||||
|
INT.RATE |
-.005*** |
-.001* |
-.001*** |
||||||||||||
|
(-6.53) |
(-2.40) |
(-2.15) |
|||||||||||||
|
Constant |
-.017*** |
-.022*** |
-.015*** |
-.020*** |
-.029*** |
-.008*** |
-.007*** |
-.014*** |
-.013*** |
-.014*** |
-.021*** |
-.024*** |
-.018*** |
-.028*** |
-.029*** |
|
(-7.14) |
(-8.73) |
(-4.97) |
(-6.21) |
(-8.36) |
(-3.53) |
(-3.11) |
(-6.64) |
(-6.14) |
(-6.52) |
(-8.69) |
(-10.92) |
(-7.41) |
(-11.66) |
(-11.99) |
|
|
R-sq |
28.68 |
31.98 |
28.78 |
32.13 |
35.81 |
28.68 |
31.95 |
22.08 |
23.03 |
23.92 |
30.55 |
34.70 |
26.33 |
39.52 |
40.37 |
|
Obs |
744 |
741 |
744 |
741 |
730 |
744 |
741 |
744 |
741 |
730 |
744 |
741 |
744 |
741 |
730 |
|
Countries |
12 |
12 |
12 |
12 |
12 |
12 |
12 |
12 |
12 |
12 |
12 |
12 |
12 |
12 |
12 |
|
Country FE |
ѵ |
ѵ |
ѵ |
ѵ |
ѵ |
ѵ |
ѵ |
ѵ |
ѵ |
ѵ |
|||||
|
Time FE |
ѵ |
ѵ |
ѵ |
ѵ |
ѵ |
||||||||||
[1] Bilateral data available only for the mentioned countries: France, Italy, Spain, Austria, Greece, Portugal, Finland and Slovenia, Netherlands, Belgium, Luxembourg and Ireland.
[2] With restrictions on speculative capital flows, limits on holding international reserves, and the possibility to adjust the exchange rate to reflect changes in efficiency wages.