Recent events make it obvious that the threat of a larger war in the Middle East now hangs like a black cloud over the 2020 election. Not for a moment do we want to distract attention from the potentially world shattering consequences that could grow from that. But the breakdown of the post-war international system is not the only tidal force shaking the American electoral landscape as the first primaries loom. We think three rip tides wholly Made in America are indispensable to understanding what is about to crash over all of us.
The first is the San Andreas Fault-like division that now runs through the Democratic Party. Everyone has heard that Michael Bloomberg is preparing to spend up to $400 million dollars by the time of the “Super Tuesday” Democratic primaries in March. Less widely trumpeted is the evidence that Dark Money now courses through the Democratic Party apparatus on a scale previously identified in the past with Republican donors like the fabled Koch “group.”
But for the first time in living memory there is more than a lone voice in the wilderness not preoccupied with supplicating the 1% in the race for the White House. This year, the split in the Democratic Party between candidates dependent on big money (or hoping to be) and those who aren’t is obvious, generating something like a billionaire’s panic.
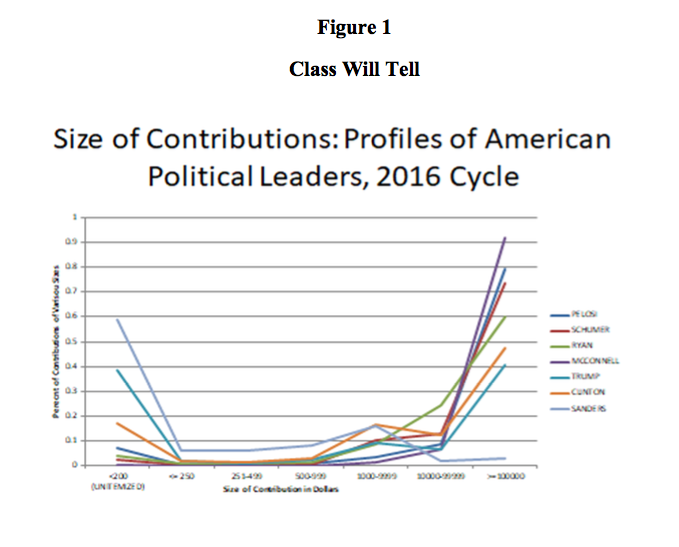
Political money is reported with long lags and seriously processing it takes time. But we expect that when the data is all in, 2020 will look like our graph for 2016, except this time two Democratic candidates – not only Bernie Sanders, but Elizabeth Warren – will show like Sanders in our graph of the 2016 race.[1] They will stand apart from all the other candidates and – note this well – the Congressional leadership in both parties.

Source: Authors’ calculations based on FEC and IRS data; adapted from Ferguson, Jorgensen, Chen, “How Money Drives US Congressional Elections: Linear Models of Money and Outcomes,” Structural Change and Economic Dynamics, https://doi.org/10.1016/j.strueco.2019.09.005
But the Grand Canyon that now yawns within the Democratic ranks is not the only giant force impinging on this year’s election: Among many voters, the Trump presidency has generated a revulsion every bit as fierce as the more extensively discussed reaction among Republicans in favor of the President. This counter-mobilization is not news: the Democratic surge in the 2018 elections (and some others since) made it front page news in the days as the votes came in.
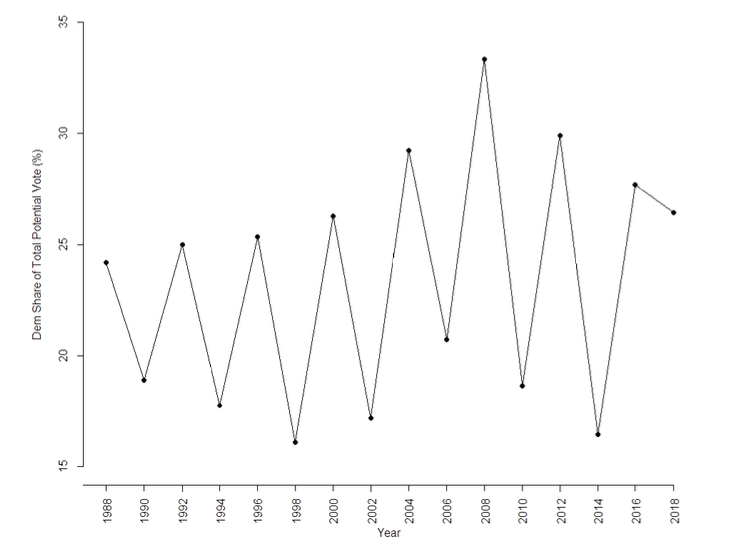
But its colossal dimensions are worth a closer look. Those raise questions about the alacrity with which many commentators are awarding the election to the President as the new year comes in. Our Figure 2 displays a statistic that one almost never sees amid the graphs filling media commentaries: The Democratic share of the total potential vote – that is, including non-voters. The seesaw pattern of voter turnout across elections is well recognized and of long standing. As a consequence, the Democratic share of that vote normally falls off a cliff because turnouts in off year elections run so much lower than in presidential election years. In the off year election of 2018, though, turnout soared – it was almost as high as in 2016. Including voters who switched from GOP to the Democrats, the total swing in favor of the Democrats was so enormous that their total vote glittered even by comparison with many presidential elections. That swing did not come cheap: the Democrats broke all records for their spending in off year elections and actually outraised the Republicans.

Figure 2: In 2018 the Democrats Mobilized a Larger Share of the Total Potential Vote Even by Comparison With Many Presidential Election Years Source: Burnham, 2010 https://www.academicapress.com/node/20 ; United States Elections Project http://www.electproject.org/
This deep current of revulsion may be compared to a potentially immovable obstacle in the way of the President’s chances for a second term. But there is a real question as to whether it really is immovable. Parts could shift or even collapse.
It is way too early to make reliable turnout predictions. In contrast to many analysts in the mainstream press, we doubt that the population as a whole is as much in love with “centrist” Democrats as is often claimed. We think there is a real chance that if one of the billionaire backed candidates prevails turnout could fall just enough to lose.
But our clinical appraisal is that the revulsion against the President President Trump in 2020 will be, as in 2018, gigantic and deeply felt. Indeed, one may wonder if the intensity of the of opposition among the superrich to the prospect of Warren or Sanders as the nominee derives precisely from fear that a vigorous Democratic campaign can readily topple Big Rocket Man, even from left of center.
That is speculation. What is clear is that the White House and the Republican Party see the potential problem. The various vehicles of the President’s campaign are raising money at a break neck pace.
Which brings us to the most telling graph of all for understanding this year’s presidential election. In 2016 Trump was outspent, but not by much – his total spending down the stretch was especially impressive, considering how late his campaign put out the begging bowl.[2]
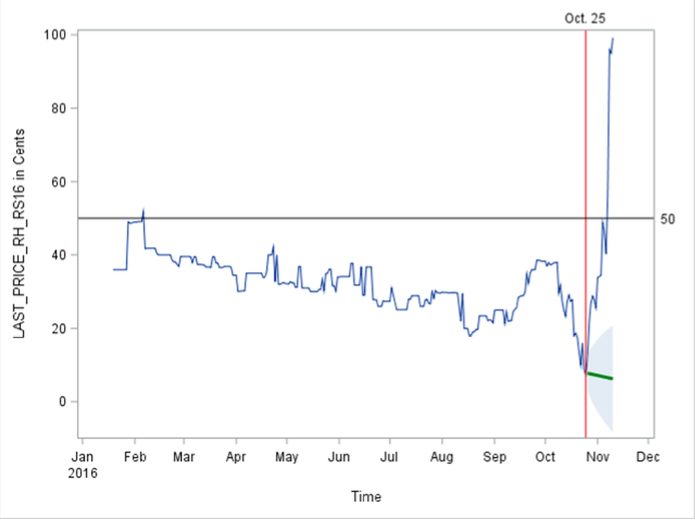
But as he battles a wave of revulsion, what happened in the last two weeks of the 2016 Senate campaign may be critical to understand. Figure 3 is adapted from an article of ours in the journal Structural Change and Economic Dynamics.

Against All Odds: Daily Price of Contract on Republican Senate Victory 2016 Shaded Fan Shows Forecast Values as of October 25 Bottom. Blue Line – Contract Price of a Republican Victory. Red Vertical Line – October 25th Source: See Text
This graph takes off from a fact now widely acknowledged – that if you are looking for evidence about the state of expectations on average, published gambling odds from sources like the Iowa Electronic Markets are very useful indicators. Here we can set aside the lengthy scholarly arguments about whether they are better than polls for predictions – we are skeptical about both, actually, for reasons that 2016 illustrated vividly. For now, the point is simply that the published odds provide some independent, outside evidence about expectations.
Our figure repeats what the handful of news stories that followed events closely at the time were also saying: Republican chances of holding onto the Senate had been dropping fairly steadily since Labor Day. On Oct. 25th: $7.10 would buy contracts worth a $100 if, somehow a miracle happened in barely two weeks.[3]
With both polls and contract prices suggesting that Donald Trump’s presidential campaign was doomed, McConnell and Republican donors knew they needed a miracle to save the Senate.
Amid brave talk about going down with guns blazing (Isenstadt, 2016); (Troyan & Schouten, 2016), “panicking GOP” Senate leaders embarked on a “last-ditch attempt to stop Donald Trump from dragging the entire GOP down with him” (Isenstadt, 2016). The response was overwhelming: many of the GOP’s most celebrated donors, including Blackstone’s Stephen Schwartzman (who contributed $2,200,000 on October the 25th, after donating $370,000 a week earlier; Sheldon and Miriam Adelson (listed as contributing $7,500,000 each on the 24th; Paul Singer ($2,000,000 on the 26th), numerous members of the DeVos family, and various oil companies and executives all pitched in. In the end, the GOP floated to victory on a massive wave of late money.
Thus the title of our essay. The surging indignation that cost the Republicans so many seats in 2018 is still running, “strong” economy or no (that is a topic for another day). But the President and his advisors have plainly taken to heart the lesson of 2016. His campaign is raising funds at a prodigious rate.
So what happens when the munificently funded tide of public dismay that dominated 2018 collides with the record setting stream of political money that Trump will conjure up this year?
This will be the central question of this year’s election – unless one of the candidates who represent true popular movements of citizens who are not from the 1% — Sanders or Warren – gains the nomination. At that point, just as in the recent British election, where many well-heeled UK business people decided that Boris Johnson, whose policies on the European Union they abominated, was the lesser evil, we may witness yet another dramatic natural experiment in the power of political money.
The views expressed here are the authors’ own and not those of any institution with which they are affiliated.
[1] As of the early fall of 2019, both of these candidates had raised very large sums, with more than sixty percent of their hoards coming in the form of donations too low to require individual reporting.
[2] We showed long ago that stories that he did not spend his own money were simply false – Trump spent considerably more than, for example, Mitt Romney did in 2012. https://www.ineteconomics.org/perspectives/blog/how-money-won-trump-the-white-house
[3] The contract is technically for a Republican sweep of both the House and the Senate. But virtually no one expected the Republicans to lose the House; the action was on the Senate. For this and other details, see Ferguson, Jorgensen, and Chen, 2020 https://doi.org/10.1016/j.strueco.2019.09.005
The figure uses a standard issue forecast model to project the range of outcomes that donors could reasonably hope for based on the campaign’s course thus far on October 25. We include it because we are tired of hearing that most big money follows polls or the odds, instead of preeminently shaping these as our investment approach maintains.


