
A new health-care reform agenda puts antitrust at the center, targeting the conglomerates that dominate insurance, pharmacies, and providers. But breaking up Big Medicine leaves deeper problems intact, from profit-driven denial and risk selection to the administrative costs of a fragmented system.
In a Nutshell
The American Economic Liberties Project (AELP) has recently issued a major proposal for improving American health care. Its Break Up Big Medicine agenda is the sharpest antitrust attack on health-care extraction yet written. It would strip the conglomerates of the ownership structure they use to loot the system. It would not change the thing that makes an insurer profitable: denying care. And it would leave standing the multi-payer billing apparatus that a universal system deletes outright.
The agenda’s spine is three bills that enact a “Glass–Steagall for health care” — structural separation of insurers, pharmacy-benefit managers, and drug wholesalers from the providers they pay. The Break Up Big Medicine Act (S.3822) is the omnibus; the Patients Over Profit Act (S.2836) and Patients Before Monopolies Act (S.4509) each execute one component — insurer divestiture of providers, and insurer/PBM divestiture of pharmacies, respectively.
Where the agenda is strongest. On extraction through conflict of interest — the self-dealing that lets a conglomerate overpay its own affiliates by up to 61% on the provider side and 7,736% on the pharmacy side to game profit caps — the three bills are decisive, and single-payer alone is not. Breaking the ownership links, capping prices at Medicare rates, and reshoring generic manufacturing is real structural work that a financing reform does not do by itself.
Where it stops short — and this is the crux. A de-conglomerated insurer is still a for-profit intermediary whose margin is premiums minus claims. Breaking up ownership does not touch that arithmetic; if anything it purifies the incentive to deny, because the insurer no longer captures a provider-side margin to offset it. The agenda answers denial with a behavioral prohibition — ban prior authorization, end utilization management — layered on top of the private system, riddled with necessary carve-outs and dependent on perpetual enforcement. Single-payer removes the actor whose incentive is to deny, not just the behavior.
Deeper still — the risk pool itself. Denial has two faces. An insurer can deny the claim, or deny the claimant — structuring its pool so the costly never enter and the newly-costly are shed. The American Economic Liberties project is clear that it has no truck with prior authorization. But the problem of adverse selection runs much deeper than that. Denial of care is often the more profitable move, and structural separation does nothing to it: a de-conglomerated insurer cherry-picks exactly as hard. Medicare Advantage is overpaid an estimated $57B/yr from favorable selection alone, and its enrollees disenroll back to Traditional Medicare at more than twice the normal rate in their last year of life — dumping the expensive cases onto the public books. Only a single universal pool removes the thing being selected against.
The administrative tax tells the same story financially. AELP claims up to $795 billion a year — roughly $6,000 per household — in recoverable administrative waste, against a US overhead of 15%+ versus 1–4% in single-payer peers. A large share of that gap is intrinsic to payer fragmentation: every provider billing hundreds of payers against hundreds of rulebooks. Structural separation and a UM ban reach part of it; the fragmentation floor comes out only when the number of payers collapses to one.
Bottom line. Single-Payer and AELP’s plan are complementary reforms operating on different axes, not substitutes. The three bills attack supply-side extraction that single-payer leaves intact; single-payer removes the denial incentive, the risk-selection game, and the fragmentation tax that the bills leave intact. The most complete design is single-payer financing paired with the agenda’s delivery-side antitrust — and the agenda, by its own framing, stops one move short of that.
Details
The three primary bills
The AELP agenda spans four pillars — break up, bring down prices, build capacity, bolster enforcement — and references more than a dozen bills. Its structural core, and the subject of this comparison, is the trio that enacts separation of payers and middlemen from providers.
Break Up Big Medicine Act S.3822
Warren (D-MA) & Hawley (R-MO), Feb 2026 · bipartisan. Prohibits insurers, PBMs, and wholesalers from owning or controlling providers — the omnibus “Glass–Steagall for health care.” Targets the vertical-integration self-dealing at the root of the extraction machine.
Patients Over Profit Act S.2836 / H.R.5433
Merkley (D-OR) & Hoyle (D-OR-04), Sep 2025. Forces insurers to divest certain Medicare providers — a narrower slice executing one component of the omnibus, focused on the public-program side where taxpayer dollars are gamed via upcoding.
Patients Before Monopolies Act S.4509 / H.R.8779
Warren & Hawley (Senate), Harshbarger (R-TN-01) & Auchincloss (D-MA-04) (House), May 2026 · bipartisan. Forces insurers and PBMs to divest their pharmacy businesses — unwinds the CVS/Caremark, Optum/OptumRx, Cigna/Express-Scripts model. AELP estimates pharmacy divestiture alone cuts drug costs >7%.
The shared theory of harm
All three attack one mechanism: a single conglomerate sitting on multiple sides of a transaction, then routing money to its own affiliates to escape the medical-loss-ratio cap. The FTC found the “Big Three” PBMs overpaid affiliated pharmacies up to SOURCED 7,736%; UnitedHealth’s insurance arm pays affiliated providers up to 61% more than unaffiliated ones. Separation makes that arithmetic impossible. It is a real, structural fix — on that axis.
Structural comparison
Six mechanisms carry the cost and dysfunction of the system. The question for any reform is not “is it good” but “which of the six does it actually restructure.” Scored 0 (no change) to 4 (structural elimination), the three bills and the full agenda light up the extraction rows and stay dark on denial, risk selection, and administration; single-payer is close to the inverse.
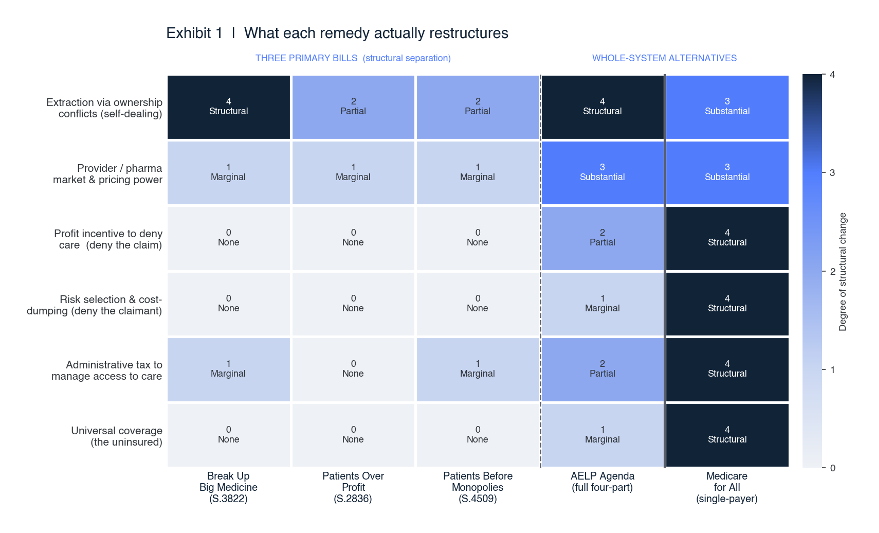
Exhibit 1: Degree to which each remedy restructures the six load-bearing mechanisms. Scores are an ANALYST assessment grounded in each bill’s operative text and the AELP paper’s own evidence.
What the bills change
Extraction via ownership conflicts (structural). This is the bills’ home turf. Separation ends transfer pricing, spread pricing, and self-preferencing at the source. The omnibus scores a 4; the two component bills a 2 each, because each unwinds only one vertical (Medicare providers; pharmacies).
Provider and pharma pricing power (marginal → substantial). Breaking vertical ties does little to horizontal hospital and pharma consolidation — the mega-system that charges 2× Medicare rates is untouched by de-integration. Only when the full agenda adds Medicare-rate price caps, site-neutral payment, and patent-abuse bans does this reach “substantial.”
What the bills do not change — and single-payer does
The incentive to deny care (zero → behavioral only). A standalone insurer still earns its margin by collecting premiums and minimizing payouts. Structural separation leaves that engine fully intact — the three bills score 0 here. The full agenda scores only a 2, because its prior-authorization ban is a prohibition policed on top of a preserved profit motive, complete with fraud/overuse carve-outs and third-party adjudication. Single-payer scores 4: it removes the shareholder-owned intermediary whose reason to deny existed in the first place. You cannot regulate an incentive out of existence as cleanly as you can remove the party that holds it.
Risk selection — the deny-the-claimant channel (zero → structural). Denial of care for profit has a second, deeper face. Insurance is at root a risk pool: it works only when the healthy subsidize the sick. A private insurer’s most profitable move is therefore not merely to deny a claim but to avoid the claimant — enroll the healthy, shed the costly. Structural separation does nothing to this; a de-conglomerated insurer cherry-picks exactly as hard, steering high-cost patients out through network design and prior-authorization friction and onto the public pool. The three bills score 0; the full agenda a 1, because a non-universal public option is itself exposed to the same adverse selection. Only a single universal pool scores 4 — when everyone is in one pool there is nothing left to select against, and nowhere to dump.
The evidence is quantified, not hypothetical. Medicare Advantage is overpaid an estimated $57B/yr from favorable selection alone; its enrollees disenroll back to Traditional Medicare in their last year of life at more than twice the normal rate, precisely when costs spike, and those disenrollees then cost the program 27% more than comparable continuous enrollees. The costly cases land on the public books. And the Patients Over Profit Act, by its own text, exempts hospitals — leaving the insurer–hospital cost-shifting channel entirely out of scope.
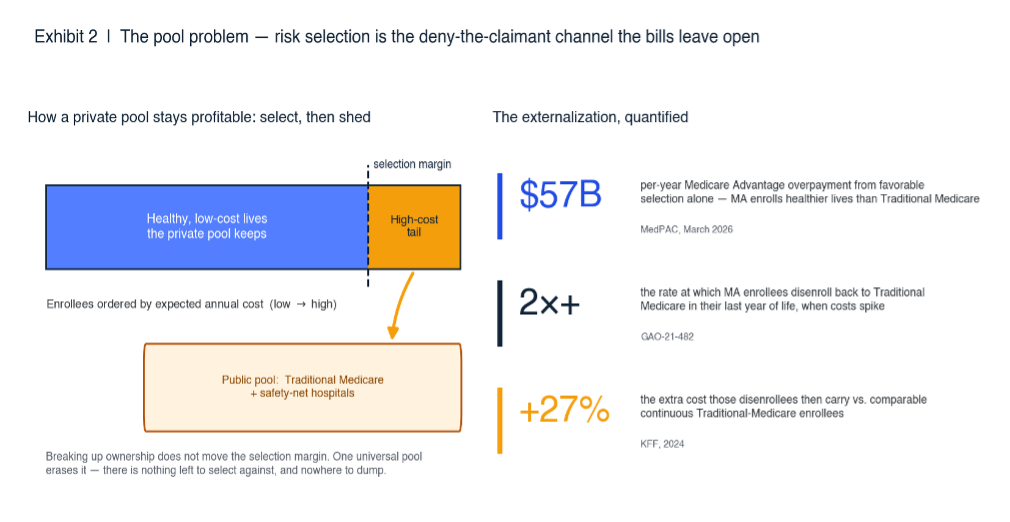
Exhibit 2: The deny-the-claimant channel. Left — an ANALYST schematic of favorable selection and cost-dumping. Right — SOURCED figures quantifying the externalization onto Traditional Medicare (MedPAC 2026; GAO-21-482; KFF 2024).
The administrative access-management tax (marginal → structural). Prior authorization, eligibility churn, network design, claims adjudication against hundreds of distinct payer rulebooks — this overhead scales with the number of payers. Breaking up ownership does not reduce that count. The agenda’s UM ban and price standardization trim the pile (score 2); a single payer with one rulebook collapses it to the peer-nation floor (score 4). AELP’s own $795B waste figure is, in effect, a measurement of the single-payer dividend that the agenda then tries to capture while keeping many payers.
Universal coverage (none → by design). The bills are silent on coverage; the agenda mentions a public option and expanding traditional Medicare as a consideration, not a centerpiece (score 1). Single-payer is universal by construction (score 4). Notably, on horizontal provider and pharma consolidation the agenda is stronger than single-payer alone — the one axis where AELP’s antitrust does work that a financing reform does not.
The structural finding
The agenda and single-payer are complements on orthogonal axes. AELP kills supply-side extraction; single-payer kills the denial incentive, the risk-selection game, and the fragmentation tax. Neither, alone, does the other’s job.
Financial comparison
The paper’s economic case rests on administrative waste: US overhead of 15%+ of health spending against 1–4% in single-payer peers, worth up to $795B/yr AELP CLAIM — before any savings from competition, drug prices, or restored clinician capacity. The structural question is how much of that prize is reachable while private payers remain.
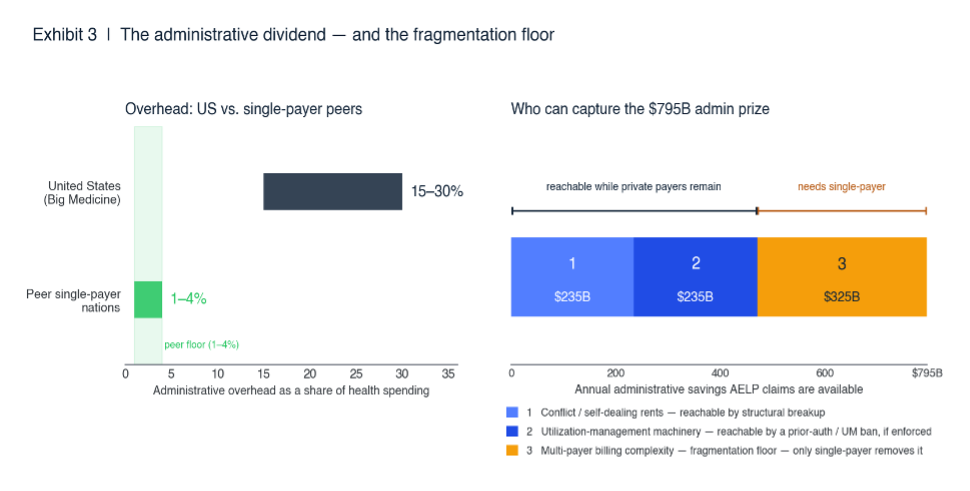
Exhibit 3: Left — overhead share, AELP’s own SOURCED figures. Right — an ANALYST decomposition of the $795B claim by reachability; segment values are illustrative of proportion, not audited splits.
Dimension | Three bills | Full AELP agenda | Medicare for All |
Extraction / self-dealing rents | Eliminated at source (separation) | Eliminated + enforced | Payer-side removed; provider/pharma persist |
Drug & provider prices | ~7% drug cut from pharmacy divestiture | Medicare-rate caps system-wide; patent-abuse bans | Monopsony price-setting system-wide |
Denial-driven cost & harm | No change ($36B UM tax remains) | UM ban trims it; enforcement-dependent | Profit-motivated denial removed structurally |
Risk selection / cost-dumping | No change — pooling untouched | No change; public option itself exposed | Single universal pool eliminates it |
Administrative overhead | Marginal | Partial — fragmentation floor remains | Collapses toward 1–4% peer floor |
Coverage / uninsured (8%) | No change | Public-option optional | Universal by design |
Net fiscal character | Lowers prices; federal outlay ~flat | Large private + public savings; outlay ~flat | Big federal outlay rise; lower total national spend in most studies ANALYST |
The fragmentation floor — the number that carries the argument
Roughly 15% of US health spending is administrative, versus 1–4% in single-payer peers SOURCED. Two of those points are conflict/self-dealing rents (reachable by breakup) and utilization-management machinery (reachable by a UM ban, if enforced). The remainder is provider-side billing complexity that exists because there are many payers with many rulebooks. That residual does not fall to an ownership breakup or a behavioral ban — it falls only when the payer count goes to one. It is the clearest financial expression of the structural gap.
Conclusions
The AELP agenda is the more enactable program — bipartisan sponsors, 71–90% polled support, no new financing mechanism to legislate — delivering real price and extraction savings near-term while keeping federal outlay roughly flat. Single-payer captures a larger, more durable share of the waste (denial incentive and fragmentation tax both go structurally, not by enforcement) but must finance the ~$2T now flowing through private premiums onto the public books — the political wall it has always hit.
But the problems not addressed are key: the agenda addresses extraction without changing the incentive to deny care, without closing the freedom to select the pool, and without removing the administrative cost of managing access — all three of which a universal system eliminates structurally rather than by regulation. The sharpest read is not either/or: the agenda’s antitrust is the delivery-side complement single-payer financing needs, breaking the horizontal hospital and pharma monopolies a public payer would otherwise negotiate with rather than dismantle.
What would sharpen these numbers
A defensible split of the $795B needs provider-side billing microdata, not a top-line ratio; and a dynamic model of a de-conglomerated insurer’s denial rate would test the “purer incentive” hypothesis directly. Both are tractable next steps.
How This Report Was Produced
This analysis was produced through Brainworks Ventures’ AI-augmented research process under human expert review. It rests on a structural method rather than advocacy: six load-bearing mechanisms — extraction through ownership conflicts, provider and pharmaceutical pricing power, the incentive to deny care, risk selection, administrative overhead, and coverage — were held fixed, and each remedy was scored against the same six on a common 0–4 scale anchored to each bill’s enforceable provisions. That common frame is what lets the report say precisely where two very different reforms overlap and where they do not.
Every structural claim traces to the operative text of the legislation it describes or to the primary evidence assembled by the sources cited. Every quantitative claim is tied to primary or official data — the antitrust enforcers, the program scorekeepers, and the agenda’s own published estimates — and each cited link was checked to confirm it resolves and supports the figure attributed to it. Where a magnitude reflects the authors’ decomposition rather than a single published number, it is labeled as such and presented as proportional judgment, not an audited split.
Every figure carries a data-integrity label so a reader can weigh the standing of each number at a glance. The labels are the working contract between this analysis and its reader: a figure marked SOURCED can be followed to its origin through the bibliography below; a figure marked ANALYST is the authors’ reasoning, offered openly as reasoning.
· LIVE Drawn from a continuously updated official feed at the time of writing.
· SOURCED Traces to a named primary or official source, quoted or directly derived from it.
· ESTIMATED A modeled or projected value derived from sourced inputs by a stated method.
· ANALYST A structured judgment by the report’s authors, reasoned from the evidence rather than lifted from one published figure.
· CLAIMED A third-party assertion — such as an advocacy estimate — reproduced and evaluated on its merits, not independently verified.
Where the evidence is incomplete, the report marks the gap and points to the data that would close it — provider-side billing microdata to split the administrative prize, and a dynamic model of a de-conglomerated insurer’s denial rate — rather than substituting an unsupported number. That discipline is what makes the confident claims in this document defensible.
Bibliography
The sources below are the primary and official records this report relies on. Every link was checked to confirm it resolves and matches the cited material; official legislative pages that gate automated access are linked to their official government location and were independently confirmed to exist with the stated bill number, title, and sponsors.
Primary Source
1. American Economic Liberties Project. “Break Up Big Medicine: A Health Care Agenda to Lower Costs and Restore Care.” AELP, August 2026. Full report (PDF) · Release & summary. Source of the $795B recoverable-waste, ~$6,000-per-household, 15%+ overhead, ~7% drug-cost, and affiliated-provider markup figures.
Government & Official Data
2. U.S. Federal Trade Commission. “Second Interim Staff Report on Prescription Drug Middlemen.” FTC, January 2025. ftc.gov. Source of the “Big Three” PBM affiliated-pharmacy markups (up to 7,736%) and spread-pricing findings.
3. Medicare Payment Advisory Commission (MedPAC). “The Medicare Advantage Program: Status Report” (Chapter 12), March 2026 Report to the Congress. MedPAC, March 2026. medpac.gov (PDF). Source of the ~$57B (11%) favorable-selection overpayment estimate.
4. U.S. Government Accountability Office. “Medicare Advantage: Beneficiary Disenrollments to Fee-for-Service in Last Year of Life Increase Medicare Spending.” GAO-21-482, June 2021. gao.gov. Source for elevated last-year-of-life disenrollment back to Traditional Medicare.
5. U.S. Senate, 119th Congress. “Break Up Big Medicine Act.” S.3822, February 2026 (Warren, Hawley). congress.gov.
6. U.S. Senate, 119th Congress. “Patients Over Profit Act.” S.2836 / H.R.5433, September 2025 (Merkley, Hoyle). congress.gov.
7. U.S. Senate, 119th Congress. “Patients Before Monopolies Act.” S.4509 / H.R.8779, May 2026 (Warren, Hawley; Harshbarger, Auchincloss). congress.gov.
Policy & Health-Research Analysis
8. KFF (Kaiser Family Foundation). “Medicare Spending Was 27% More for People Who Disenrolled from Medicare Advantage than for Similar People in Traditional Medicare.” KFF, 2024. kff.org. Source of the 27% higher post-disenrollment spending figure.
The author is grateful to Thomas Ferguson for comments and discussion.