
The collapse of America’s political center isn’t a mystery. What looks like a sudden political crisis is really the result of an economy that’s been abandoning ordinary workers for decades.
Our new INET Working Paper analyzes the macroeconomic roots of the collapse of the political center in the United States. The argument is straightforward. Of course, all sorts of demagogic political appeals – racism, sexism, anti-immigrant stereotyping – have played integral roles in the rise of the right, but a fundamental underlying driver is popular disillusionment with an economy that has for decades failed millions of people and has now eroded the social underpinnings of America’s economy to a breaking point.
The affordability crisis hurting working-class and middle-class U.S. households is a long-term emergency that is rooted in inadequate pay and insecure jobs, not just (recently) rising prices, and has eroded the social underpinnings of America’s economy to a breaking point.
We begin with an analysis of the record of the Biden administration on wages and incomes — to highlight macroeconomic policy’s wrenching impact on the population as a whole over a long period of time. We consider real hourly wages, real weekly earnings, the so-called employment cost index (see Figure 1), and real median family and household income, and the conclusion is plain and simple: running the economy ‘hot’ under Biden’s watch did not structurally improve hourly wages, weekly earnings and incomes growth relative to pre-pandemic trends.
Figure 1: Employment Cost Index: Private Industry
(constant 2019 U.S. dollars; 2019 =1.0)
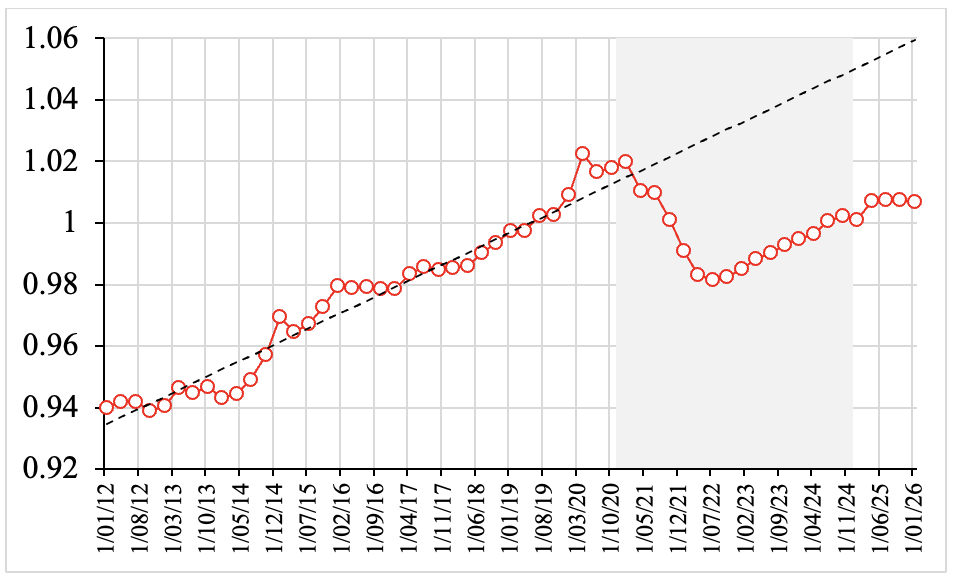
Source: Authors’ calculations based on U.S. Bureau of Labor Statistics, Employment Cost Index (ECI): Wages and Salaries: Private Industry Workers. Notes: The nominal ECI has been deflated using the CPI (with base year 2019 = 100). The dashed line is the linear trend line estimated using OLS for the (pre-pandemic) period 2012q1 – 2019q4. The shaded area indicates the Biden era
There was no major, transformative break in trends in the wages of American workers, union strength did not increase (Figure 2), and the bottom rungs of the American income ladder did not leap upward, as is clear by looking at Figure 3. In this figure, we plot 90-10 household income inequality during 1967-2024 and 80-20 family income inequality during 1947-2024. Income inequality declined steadily and significantly between 1947 and the late 1970s, but then exhibited a steady upward trend, uninterrupted by Bidenomics.
Figure 2: America’s Unions Are in a Deadly Spiral: Union Density and Collective Bargaining Coverage (Percent)
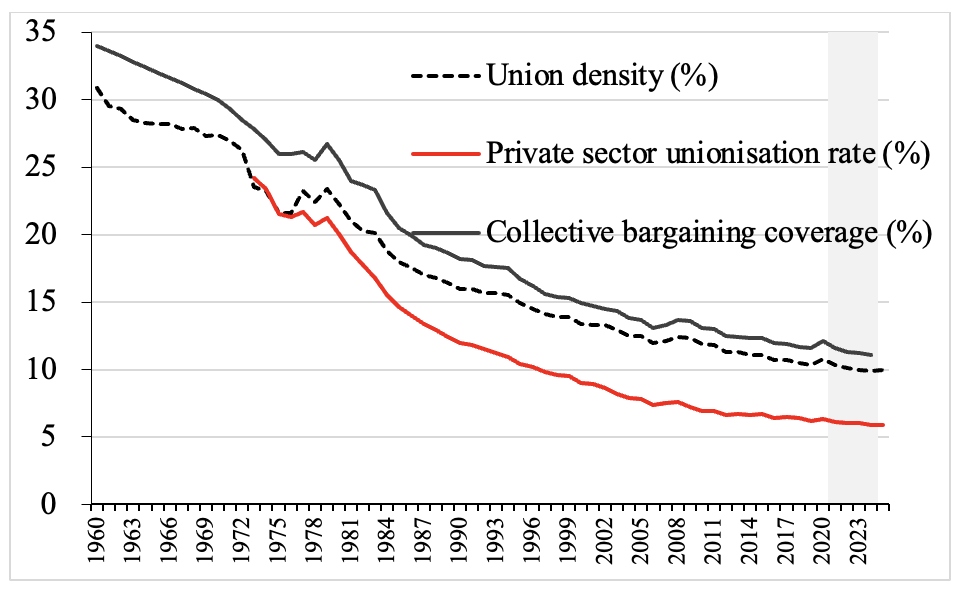
Source: Data on (aggregate) union density (1960-1982) from Mayer (2004); data on (aggregate) union density (1983-2025) from Bureau of Labor Statistics (BLS). Data on private sector union density are from Hirsch, Macpherson and Even (2026). Data on collective bargaining coverage are from OECD ICTWSS Database; collective bargaining coverage is the percentage of employees with the right to bargai
Figure 3: Income Inequality Over Time: 90-10 Household Income Inequality (1967-2024) and 80-20 Family Income Inequality (1947-2024)
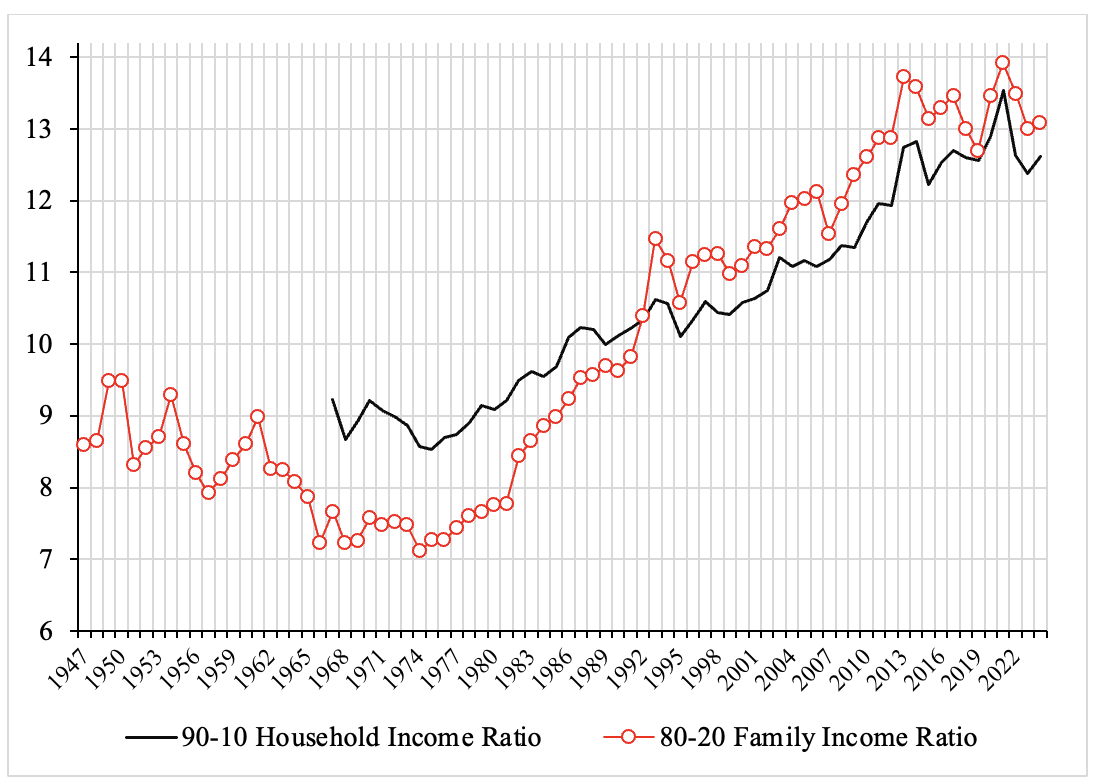
Source: Authors’ calculations based on data on household incomes by deciles and family income by quintiles from Current Population Reports, U.S. Census. Income is in 2024 dollars, adjusted using the C-CPI-U (2000-2024) and R-CPI-U-RS (pre-2000).
Consumer sentiment turned negative under Biden, not because of mysterious “bad vibes,” but due to disappointing real income growth. Bidenomics was a steady continuation of the Reagan-Bush(s)-Clinton-Obama status quo that has hardwired deep structural inequalities into America’s economic development. But what was puzzling is that from the second quarter of 2021 onwards, real personal consumption expenditure began to grow considerably faster than could have been expected based on its pre-pandemic trend. The acceleration of personal consumer spending during 2021-2025 is all the more remarkable, because the growth rates of real personal income, real disposable personal income and compensation of employees all declined relative to their growth rates during the pre-pandemic years 2017-2019 (see Figure 4).
Figure 4: Growth of Real Personal Income and Real Personal Consumption Expenditure during 2014-2019 versus 2021-2025 (Percent)
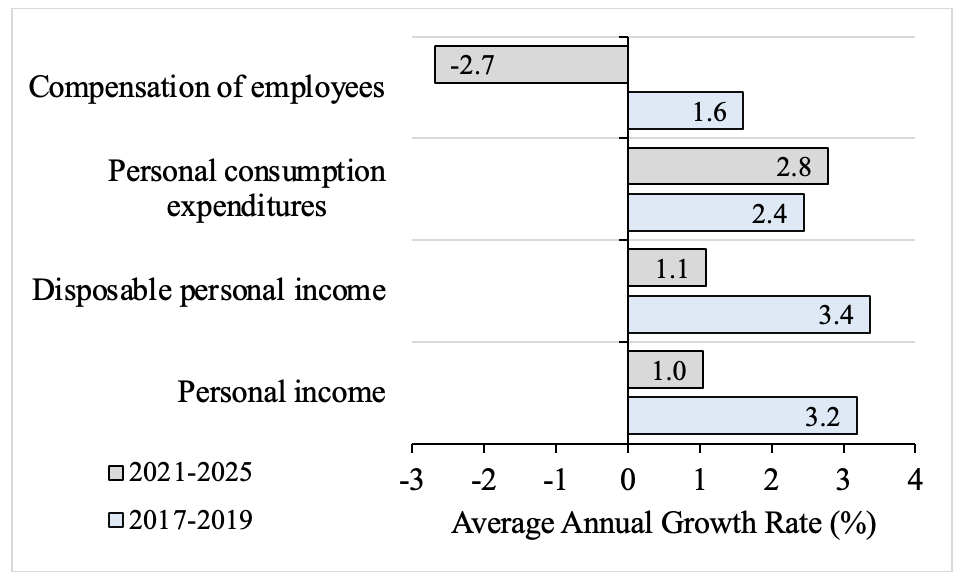
Sources: Authors’ calculations based on BEA data.
What did grow markedly after 2020 was the percentage of wealth in the hands of America’s most affluent citizens, largely driven by the Federal Reserve’s quantitative easing policies at the onset of COVID and later the AI boom. This led to a powerful K-shaped wealth effect on personal consumption expenditures. It is the spending by the super-wealthy (albeit not as large as sometimes suggested in the financial press) that keeps the U.S. economy growing, helped by massive investments in AI data-centers. We review other studies of this wealth effect in detail and set out what we believe are defensible estimates.
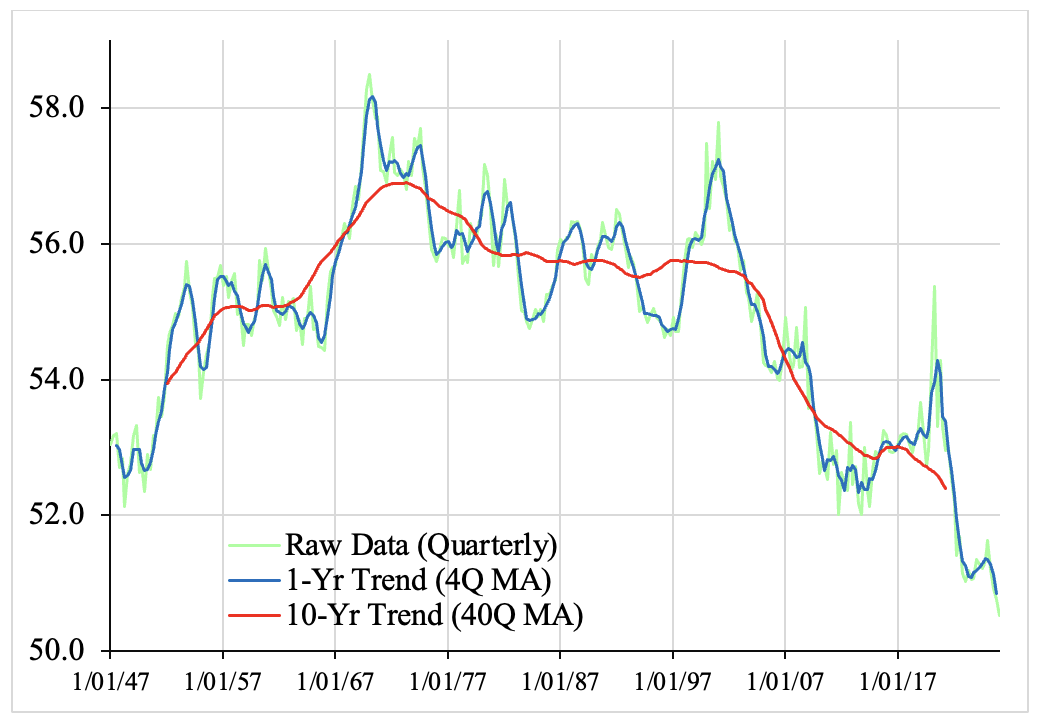
The paper then analyses the long sweep of macroeconomic policy since the New Deal. It shows that key macroeconomic trends spiraled steadily downward for the majority of American households and workers during the Neoliberal era regardless of which party occupied the White House. We econometrically examine the long fall of total employee compensation as a percent of GDP under both Democratic and Republican presidencies – as shown in Figure 5.
Our Figure 5 displays statistics for labor compensation over time in three different ways: Figures for each quarter are in green; while annual averages show in blue to smooth out very short-run fluctuations in the green data. We also present a ten-year average in red, a technique widely used for displaying longer term trends. This latter graph is instructive for its hints about how the life worlds of real people can for a time run almost upside down.
Figure 5: The Labor Income Share (1947q1-2026q1)
(Compensation of Employees as a Percentage of GDP)
Source: Compensation of employees https://fred.stlouisfed.org/series/COE; GDP
Our analysis shows that the declining labor income share is not an artifact of a “China shock” or another sudden shift after 2000 as recently claimed; it is caused by the Neoliberal policy turn of the 1970s, which prioritized inflation control over (full) employment, favored shareholders while discriminating against workers, promoted deregulated insecure jobs over steady stable employment, and brought permanent austerity for those dependent on social security and healthcare and many sectors of education.
The same pattern holds for the rise in the share of income garnered by the superrich (see Figure 6), steadily rising income inequality (Figure 7) and wealth inequality and the fall in shares of the middle class and the poor over seventy years.
Figure 6: Extreme Inequality: The Income Share of the Richest 1% (1947-2024)
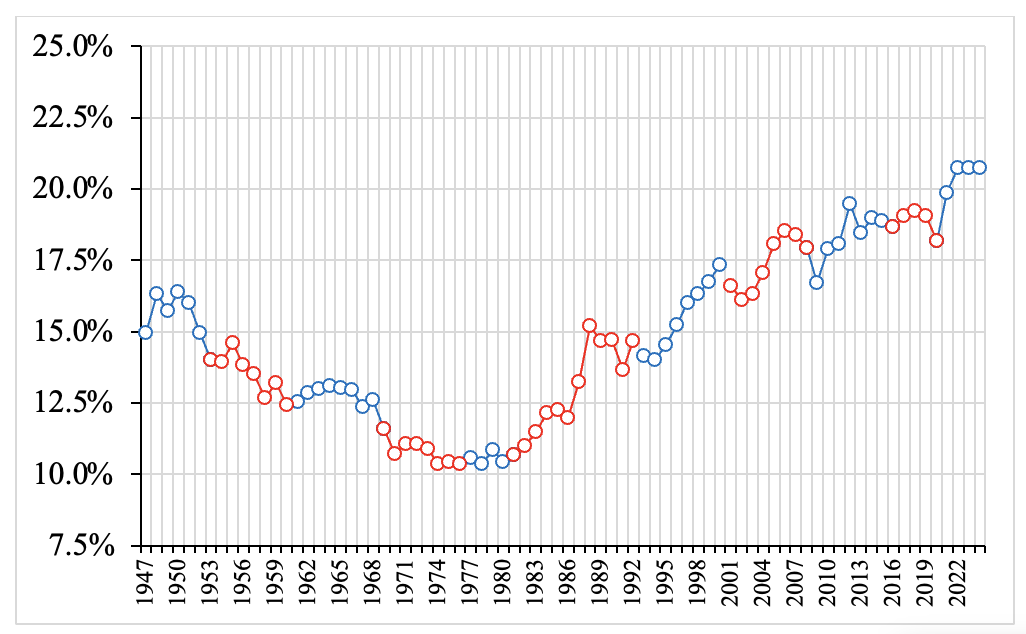
Source: World Inequality Database (downloaded 26 October 2025). Notes: Fiscal income shares, tax units, adults, equal split. Blue: Dem in White House; Red, Republican in White House.
Over the Neoliberal period as a whole, no important difference in these (macroeconomic) outcomes is traceable to one political party. Clearly, wide differences between parties exist in regard to abortion, gender, gay rights, and — especially now — race and civil rights, but as long as the bipartisan consensus on Neoliberal macroeconomic policy remains in place, the social underpinnings of America’s economy will continue to be weakened.
Figure 7: Gini Coefficient of Family Incomes (1947-2024)
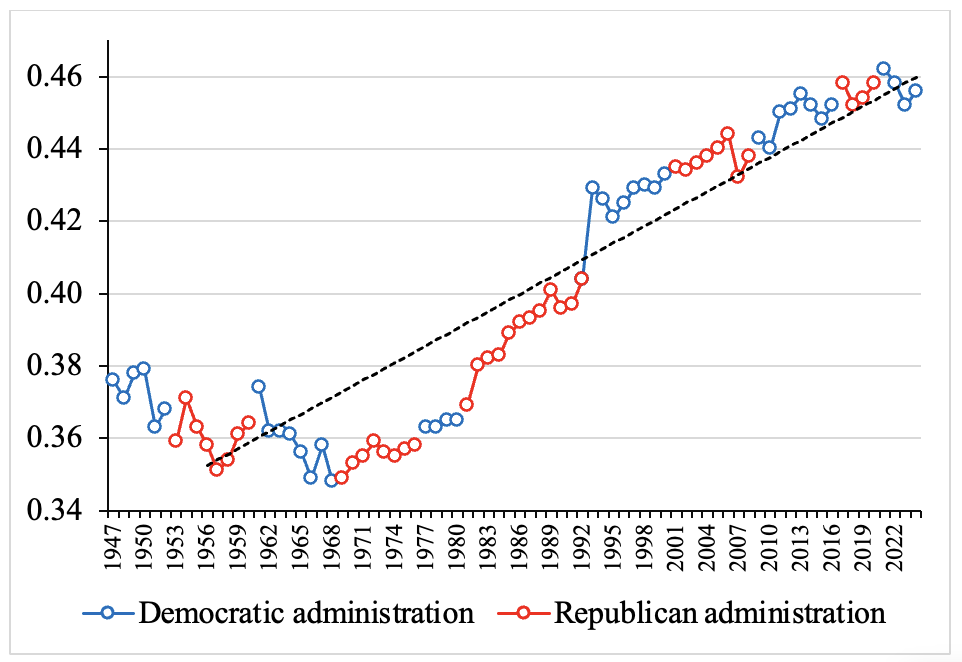
Source: U.S. Census Bureau data.
The evidence is unmistakable: since the abandonment of the New Deal framework in the 1970s, macroeconomic outcomes have consistently deteriorated for most Americans regardless of which party held the presidency. With Democrats in thrall to Wall Street, high tech, and other corporate interests including parts of health care, the parties have managed to smother the “American Dream” of middle-class prosperity and upward social mobility. Prioritizing the freedom and financial opportunities of shareholders above all else, American factories closed while jobs moved offshore and imports poured in under Republican and Democratic Presidents alike.
The consequences for the U.S. economy of these neoliberal macroeconomic policies have been dire. Potential growth has been in secular decline for decades, as labor productivity growth in most industries slowed down, and even became negative in manufacturing after 2010. The bipartisan regime of low real wage growth and stagnating real incomes for the many weakened domestic demand growth, lowered capacity utilization and hurt profits and investment in most American industries (excluding finance and the AI industry). Business investment has declined, to an average of 2.8 percent of GDP over the past decade (2016-2026) from 5.3 percent during 1960-1974 — notwithstanding the recent boom in AI data-centre investment.
Indeed, the stock-market exuberance that has unduly escalated the share values of American AI firms, the rise in wealth inequality, and the massive wealth effect on spending are, jointly with the gigantic capital expenditures on AI data-centre infrastructure, keeping up the growth of effective demand that would have stalled otherwise (i.e., in the face of stagnating wages and incomes for the majority of Americans). Aided and abetted by the Fed’s perpetual backstopping, the U.S. financial sector has been blowing ever more financial bubbles in an increasingly unequal and decaying economy to keep the wealth effect going and achieve near full employment outcomes. This is, indeed, the ultimate and monumentally undesirable macroeconomic consequence of more than four decades of bipartisan Reaganomics: a system of private opulence and public squalor (using John Kenneth Galbraith’s words), or, equally appropriate, socialism for the rich and permanent austerity for everyone else. The widespread discontent and popular disillusionment with a system that is working only for the oligarchs is not surprising.
We conclude the paper drawing out lessons for the future, focusing on how the evident tensions within the Democratic party may affect its response to the Trump administration’s escalating policy dilemmas.