In this post, I’d like to take a first step toward putting the mechanics of this into an empirical context. Here is the graph, which is my update of
one from Brad Setser.
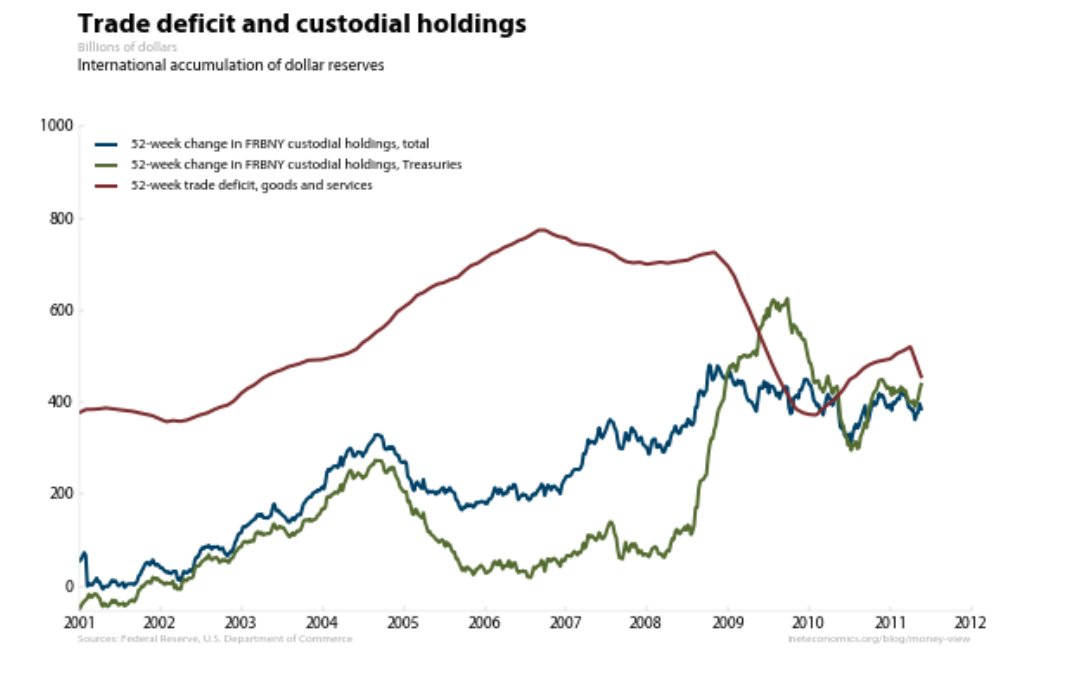
The red line is the 52-week trade deficit (on goods and services). The blue line is the accumulation of U.S. government securities held in custody by the Federal Reserve Bank of New York for the rest of the world. The green line is like the blue, but it represents only Treasuries (the difference between the two being agency debt).
In money terms, we could say that all U.S. imports are covered by U.S. exports. Some of those are exports of current goods and services, and the rest are claims on future goods and services. Such claims take the form of U.S. liabilities, which will one day be redeemed for dollars (another U.S. liability), which will in turn eventually be used to buy U.S. output.
The trade deficit is just the amount of current imports not paid for with current exports, and so it is, equivalently, the amount of claims on future U.S. product that are being accepted by the rest of the world as payment instead. Those promises take the form of claims on U.S. entities, and here we see that FRBNY custodial holdings of claims on the U.S. government account for a significant fraction of them.
There’s a bit of a story in this graph. Remember, the U.S. government was close to fiscal balance in 2001, so the rest of the world had to accumulate some other kind of claim on the U.S.—that’s the big gap between the blue line and the red line. If you wanted to accumulate claims on the U.S., you had to find something other than Treasury debt. A lot of that demand ended up in the parallel banking system, ultimately financing increased borrowing on the part of U.S. households.
From 2005 until the height of the financial crisis at the end of 2008, much of the accumulation was of agency debt—as seen in the widening gap between the blue and green lines. During the crisis, that reversed rapidly, and the rest of the world sold agency debt for Treasuries; Treasuries (green) were accumulating faster than the total (blue) in 2009 and 2010.
At the same time, the rest of the world rapidly slowed its accumulation of non-government U.S. liabilities—the gap between the trade deficit and the change in custodial holdings almost disappears. Again, this shows up in the quantity of money in the parallel banking system, this time as a contraction.
There has been a fair bit of confusion on the U.S. external balance, unsurprisingly as there are a lot of moving parts. A money view of the issue keeps things straight. I’ll pick up this topic again soon, and take a look at the debate on the status of the dollar as the international reserve currency.