On the reflexive relationship between inflation and inflation narratives
Inflation is a notoriously persistent macroeconomic variable. Ever since the influential work of Irving Fisher, factors feeding the inertia of price trends over time have been thought to be more forward-looking rather than adaptive. It is no surprise, then, that expectations of inflation also exhibit underlying persistence. There is likely a reflexive relationship between inflation and inflation expectations (Binder and Kamdar, 2022). And the emerging field of narrative economics is contributing to our understanding of expectations by providing evidence that visceral story threads about inflation significantly forecast inflation (Hong et al., 2022). One hypothesis is that narratives about inflation are connected to, and possibly underpin, the ebbs and flows of both consumer- and investor-based expectations. Consequently, narratives about inflation ought to stimulate narratives about interest rates (Mangee, 2021).
Conventional wisdom suggests that, although they co-move through time, interest rate policy decisions respond to data releases on consumer and producer prices. One preliminary way to gauge a factors’ narrative intensity is to proxy based on internet search queries for a particular topic or term. That is, narratives are good candidates for assessing expectations about fundamentals. Figures 1 and 2 plot the weekly Google Trends search interest for the terms “inflation” and “interest rates,” respectively, over the five-year period June 2018 through June 2023.
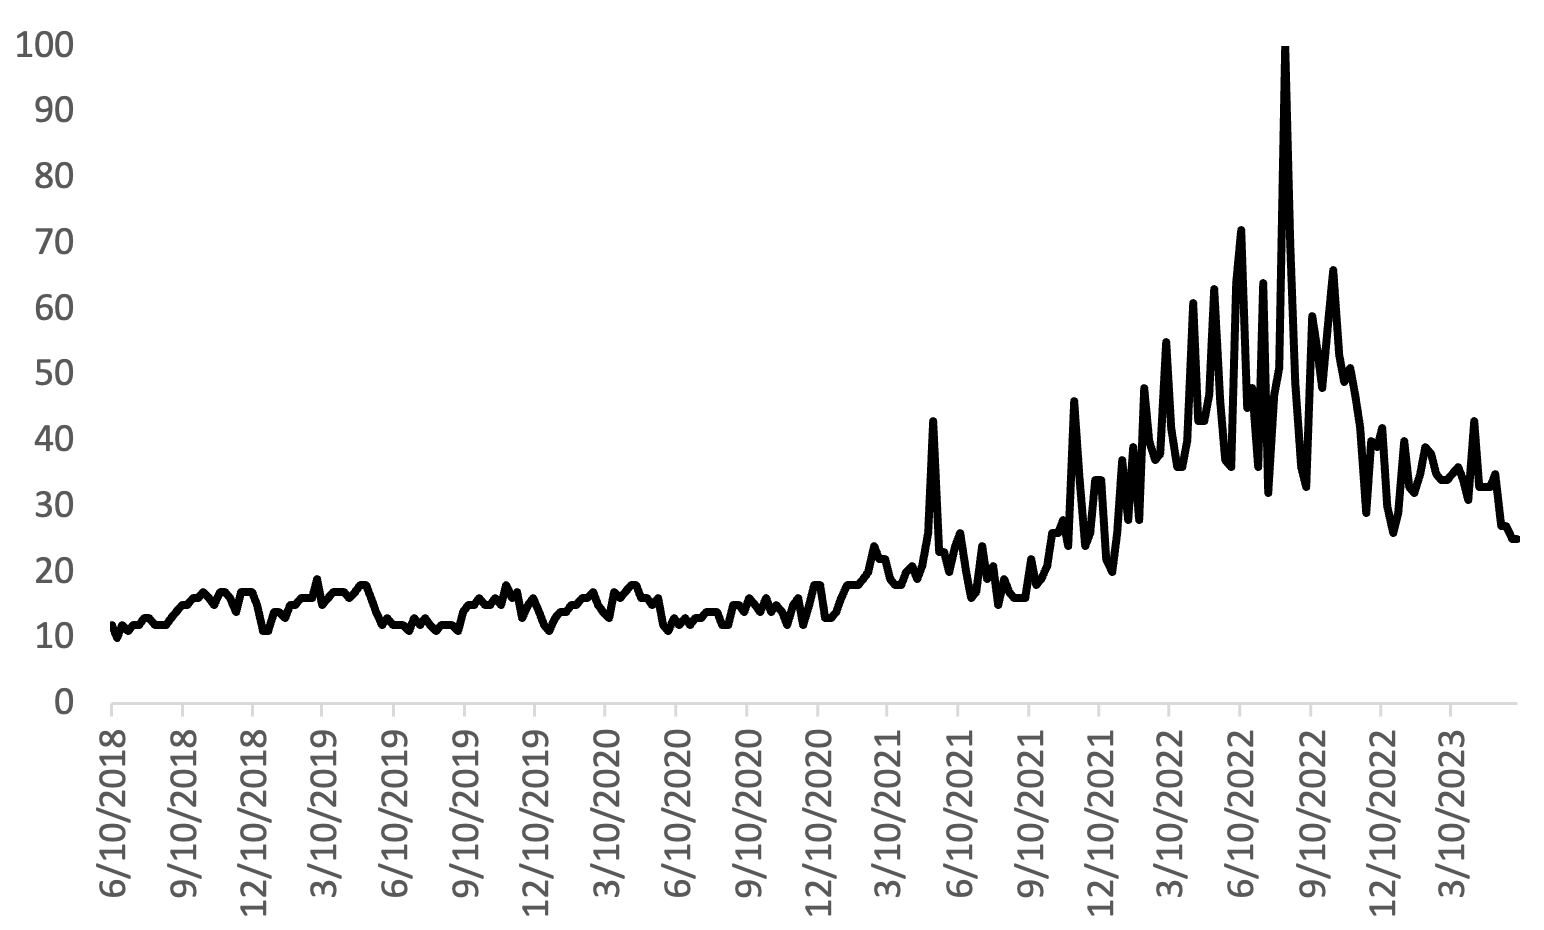
Figure 1: Inflation Google Trends Search Interest Notes: The figure plots the US Google Trends searches for “inflation” during the period 2018 through 2023. The vertical axis measures search interest.
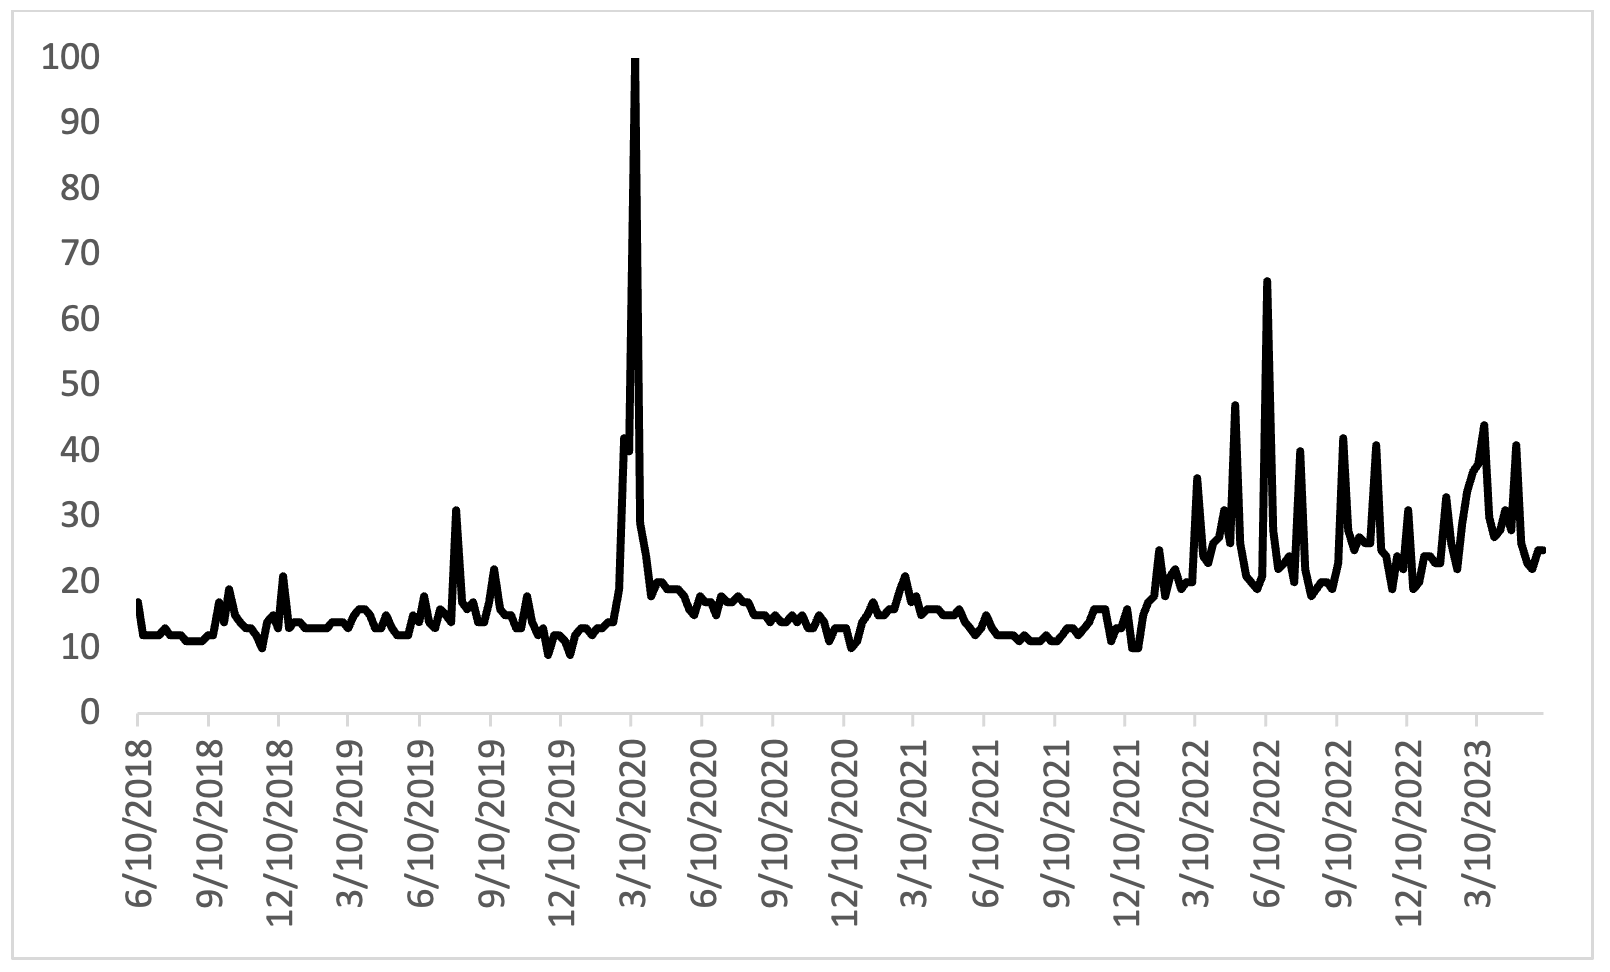
Figure 2: Interest Rates Google Trends Search Interest Notes: The figure plots the US Google Trends searches for “interest rates” during the period 2018 through 2023. The vertical axis measures search interest.
The visible upward trend in both series beginning in late 2021 suggests that narratives about the two series may co-move over time. Statistical evidence bears this out – the Spearman rank-order correlation coefficient is .58 (p-value=.000) strongly rejecting the null hypothesis that the two series are uncorrelated. Does one narrative proxy lead the other? A simple Granger causality test of the null hypothesis that lagged values of inflation narratives do not explain future interest rate stories strongly rejects the null that there is no “causality” (p-value=.003). However, the test fails to reject that interest rate narratives Granger cause inflation narratives (p-value=.273).
That stories about inflation explain variation in future stories about interest rates, but not the other way around, suggests that the stories individuals tell to others, and to themselves, are rooted in fundamental factors, feed into related narratives, and represent a reasonable, or rational, process consistent with theory. In fact, the correlation between inflation narratives and the popular survey-based University of Michigan Inflation Expectations measure is a striking .77. These two variables are plotted against each other in Figure 3; the positive co-movement is evident and suggest that even formal measures of consumer expectations may be connected to stories about underlying fundamentals.
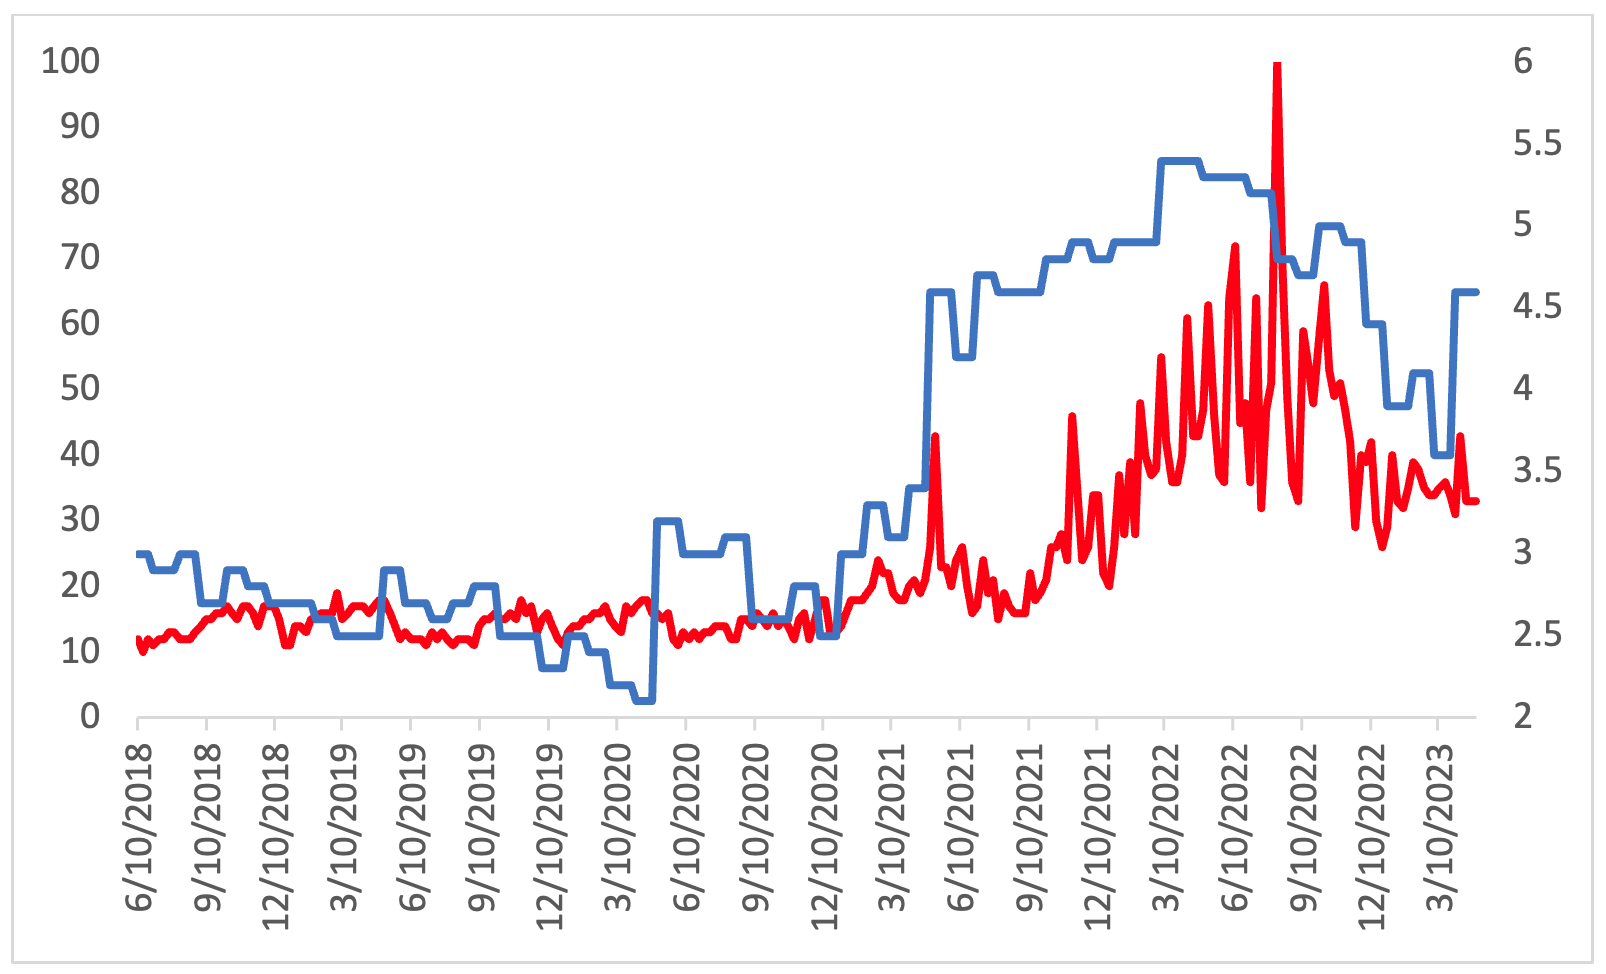
Figure 3: Inflation Google Trends Search Interest and UMich Inflation Expectations Notes: The figure plots the Google Trends search interest for “inflation” (red line, left axis) against the University of Michigan Inflation Expectations variable (blue line, right axis).
Moreover, there may be secondary feedback effects from the stories: data releases on consumer and producer prices feed inflation narratives, inflation narratives feed FOMC policy expectations, FOMC policy expectations feed interest rate narratives, and interest rate narratives drive stock market forecasts.
Let us take a preliminary look. Correlation coefficients between inflation and interest rate narratives and stock market outcomes are reported in Table 1. Inflation and interest rate narratives versus contemporaneous S&P500 weekly returns both produce negative coefficients (p-value=.022 and .056, respectively). These findings support the conventional view that higher inflation and interest rates are bearish for stock returns. Predictive correlations based on one- and four-week lagged narratives, however, are not as significant for returns.
Table 1: Correlation Statistics between Narratives and Stock Market Outcomes
Narratives versus S&P500 Returns | Narratives versus S&P500 Volatility |
(inflation, returns) = -.14 (.022) | (inflation, volatility) = .195 (.002) |
(inflation_1, returns) = -.14 (.025) | (inflation_1,volatility) = .212 (.001) |
(inflation_4, returns) = -.06 (.376) | (inflation_4, volatility) = .227 (.000) |
(interest rates, returns) = -.12 (.056) | (interest rates, volatility) = .529 (.000) |
(interest rates_1, returns) = -.06 (.378) | (interest rates_1, volatility) = .520 (.000) |
(interest rates_4, returns) = .029 (.650) | (interest rates_4, volatility) = .448 (.000) |
Notes: Spearman Rank-Order Correlations reported. Volatility is measured as the rolling-window of eight-week standard deviation of SP500 returns. Returns are measured as the log-difference between SP500 prices. P-values reported in parentheses.
The story, however, is much different for S&P500 volatility. Yes, coefficients for inflation and interest rate narratives on current volatility are both positive and significant, particularly so for interest rates (correlation = .529). But the forecasting performance of narratives on volatility is just as impressive. The one- and four-week lagged values for both narratives on volatility all produce highly significant and positive coefficients (especially, again, for interest rates). This gives a nod to the potential for fundamentals-based narratives to empirically explain future stock market volatility.
Indeed, stories coursing through our public spheres may hold valuable clues about how individuals interpret the diversity of news as it unfolds day-to-day. Important events, like the pandemic or a dramatic shift in monetary policy, are non-repetitive in nature and introduce heightened levels of uncertainty about their meaning for the future. When underlying relationships change, individuals are forced to contextualize the meaning of novel events through a narrative lens. These preliminary results warrant further investigation into the roles that narratives about fundamentals play in influencing investor expectations and driving outcomes in equity markets.
References
Binder, Carola and Rupal Kamdar (2022), “Expected and Realized Inflation in Historical Perspective,” Journal of Economic Perspectives, 36(3): 131-156.
Hong, Yongmiao and Jiang, Fuwei and Meng, Lingchao and Xue, Bowen, “Forecasting Inflation with Economic Narratives and Machine Learning” (July 29, 2022). Available at SSRN: https://ssrn.com/abstract=4175749 or http://dx.doi.org/10.2139/ssrn.4175749
Mangee, Nicholas (2021), How Novelty and Narratives Drive the Stock Market: Black Swans, Animal Spirits and Scapegoats, Cambridge University Press.
University of Michigan, University of Michigan: Inflation Expectation [MICH], retrieved from FRED, Federal Reserve Bank of St. Louis; https://fred.stlouisfed.org/series/MICH, June 9, 2023.