
Europe’s new fiscal rules still bind policy to fragile estimates of potential output. For Italy, targeting lower unemployment could sustain stronger growth, improve deficit outcomes, and expose the self-defeating logic of austerity when debt is measured against a stagnating economy.
1. Introduction
In 2024, the European Union introduced new fiscal rules. But the changes are more apparent than real and do not address the limitations highlighted by the European Fiscal Board in 2019. In a recent paper we critically examine the new rules and assess how the effect of an alternative policy—aimed at achieving a low unemployment rate—would affect the key public finance variables relevant to the European Commission’s assessments. This blogpost summarizes our key results. The case study focuses on Italy, chosen both for the size of its economy and for its paradigmatic adherence to fiscal restraint.
The discussion of the fiscal rules and their possibly perverse consequences is particularly relevant now, since new data show that the Italian deficit to GDP ratio for 2025 was 3.1%, just above the 3% limit, making it impossible for Italy to exit the EU’s excessive deficit procedure, despite the government’s strenuous efforts to do so. The government ascribes the lapse to higher-than-expected loss of revenues caused by tax credits, and to Next generation EU expenditures, which must be accommodated within the budget constraints. However, GDP growth in 2025 also ran slightly below the forecast of a year ago by the Ministry of Economy and Finance. We argue that if growth falls short of expectations, the resulting increase in the deficit-to-GDP ratio could limit future fiscal policy space, even before taking into account the direct effects of multiple international crises on GDP. Among these, the closure of the Strait of Hormuz is expected to cause a major world-wide supply shock, that in the best scenarios will slow down the already anemic European growth, but if prolonged is most likely to cause recession. This will exacerbate the negative and self-defeating effects of restrictive fiscal policies and hinder the industrial policies aimed at the transition towards alternative sources of energy. At the same time, the necessary reductions in the use of the scarce supplies of certain primary inputs might be best addressed by means of well-focused administrative measures rather than generalized cuts in aggregate demand and income.
2. The New Fiscal Rules for High-Debt Countries
The European Union’s new fiscal rules, which took effect on April 30, 2024, require the European Commission, national governments, and the European Council to agree on a 4–5-year structural adjustment plan (extendable to 7 years in the presence of reforms and investments consistent with EU objectives). The key metric to assess compliance of countries with a high debt to GDP is growth in net public spending, net of interest on debt, EU funds co-financing, extraordinary measures, and cyclical variations in unemployment benefits. Deviations exceeding 0.3% in a single year or 0.6% cumulatively trigger the celebrated excessive deficit procedure, requiring a deficit reduction of 0.5% annually.
Under the procedure, countries must meet the same numerical targets: a maximum overall deficit of 3% of GDP (trending toward 1.5%), an improvement in the structural primary balance of at least 0.4% annually (0.25% in the case of a seven-year plan), and a reduction in the debt-to-GDP ratio of 1% per year. The adjustment must be linear and ensure, by the end of the period, a primary balance sufficient to sustain debt reduction even after the plan ends, taking into account population aging and demographic decline. It is obvious that these ‘new’ rules result from a compromise and contain contradictory elements: certain items excluded from the calculation of net expenditure (such as interest) reappear in the deficit and debt constraints. The Commission’s Debt Sustainability Analysis (hereinafter DSA) also depends crucially on medium- to long-term projections of potential output, whose estimates and role under the previous rules have been the subject of strong criticism; and on medium- to long-term estimates of inflation and interest rates, which are inevitably very uncertain. Consequently, the forecasts made within the DSA are often not confirmed by the subsequent actual evolution of macroeconomic data and cannot serve as a solid basis for binding rules (see e.g. Heimberger, 2023, p. 15; Schuberth, 2024).
To sum up, the main principle underlying the new rules is that the growth of net spending must remain systematically lower than that of potential output, to ensure a positive primary balance and compliance with the numerical constraints on fiscal balances and debt ratios.
3. Policy Implications and the Self-Defeating Nature of Fiscal Rules
Estimates of potential output, therefore, remain central to defining the permissible expenditure paths in debt sustainability analysis and, as in the past, introduce elements of “procyclicality” — or, more accurately, “circularity” — into the policies proposed by the Commission.
The reason for such circularity is that the theoretical model underpinning European rules underestimates the recessionary impact of spending cuts, limiting their effect to the short term and assuming that the long-term trend in potential GDP is independent of restrictive fiscal policies, with the recessionary effects of the latter completely dissipating within three years, leaving no permanent scars (European Commission, 2024; see Ciccone, 2025). The Commission does not explain the reasons for this assumption.
Speculating on the possible justifications, with reference to a traditional strand in macroeconomic literature, the likely view is that the Commission believes that changes in wages, prices, and interest rates can restore aggregate demand to its equilibrium level, i.e. to align it to potential aggregate supply. But both analytical results and empirical research have questioned these mechanisms and pointed out severe difficulties (Stirati, 2025; Heimberger et al., 2024 for surveys of some of the problems).
One major difficulty is that this “textbook” macroeconomic view, according to which changes in aggregate demand—and thus fiscal policies—would produce only transitory effects, has recently been challenged by the literature on hysteresis, which has documented permanent negative effects on the level of GDP even in mainstream studies and research carried on at major international institutions (e.g., Ball and Onken, 2022; Blanchard et al., 2015; Cerra et al., 2023; Furlanetto, 2025).
For Italy, post-2008 data (Figure 1) clearly show the permanent damage caused by the 2008–09 and 2011–13 recessions, with GDP declines that had not yet been recovered by 2019. In contrast, the suspension of fiscal rules during the pandemic enabled a recovery thanks to the ability to implement expansionary policies.
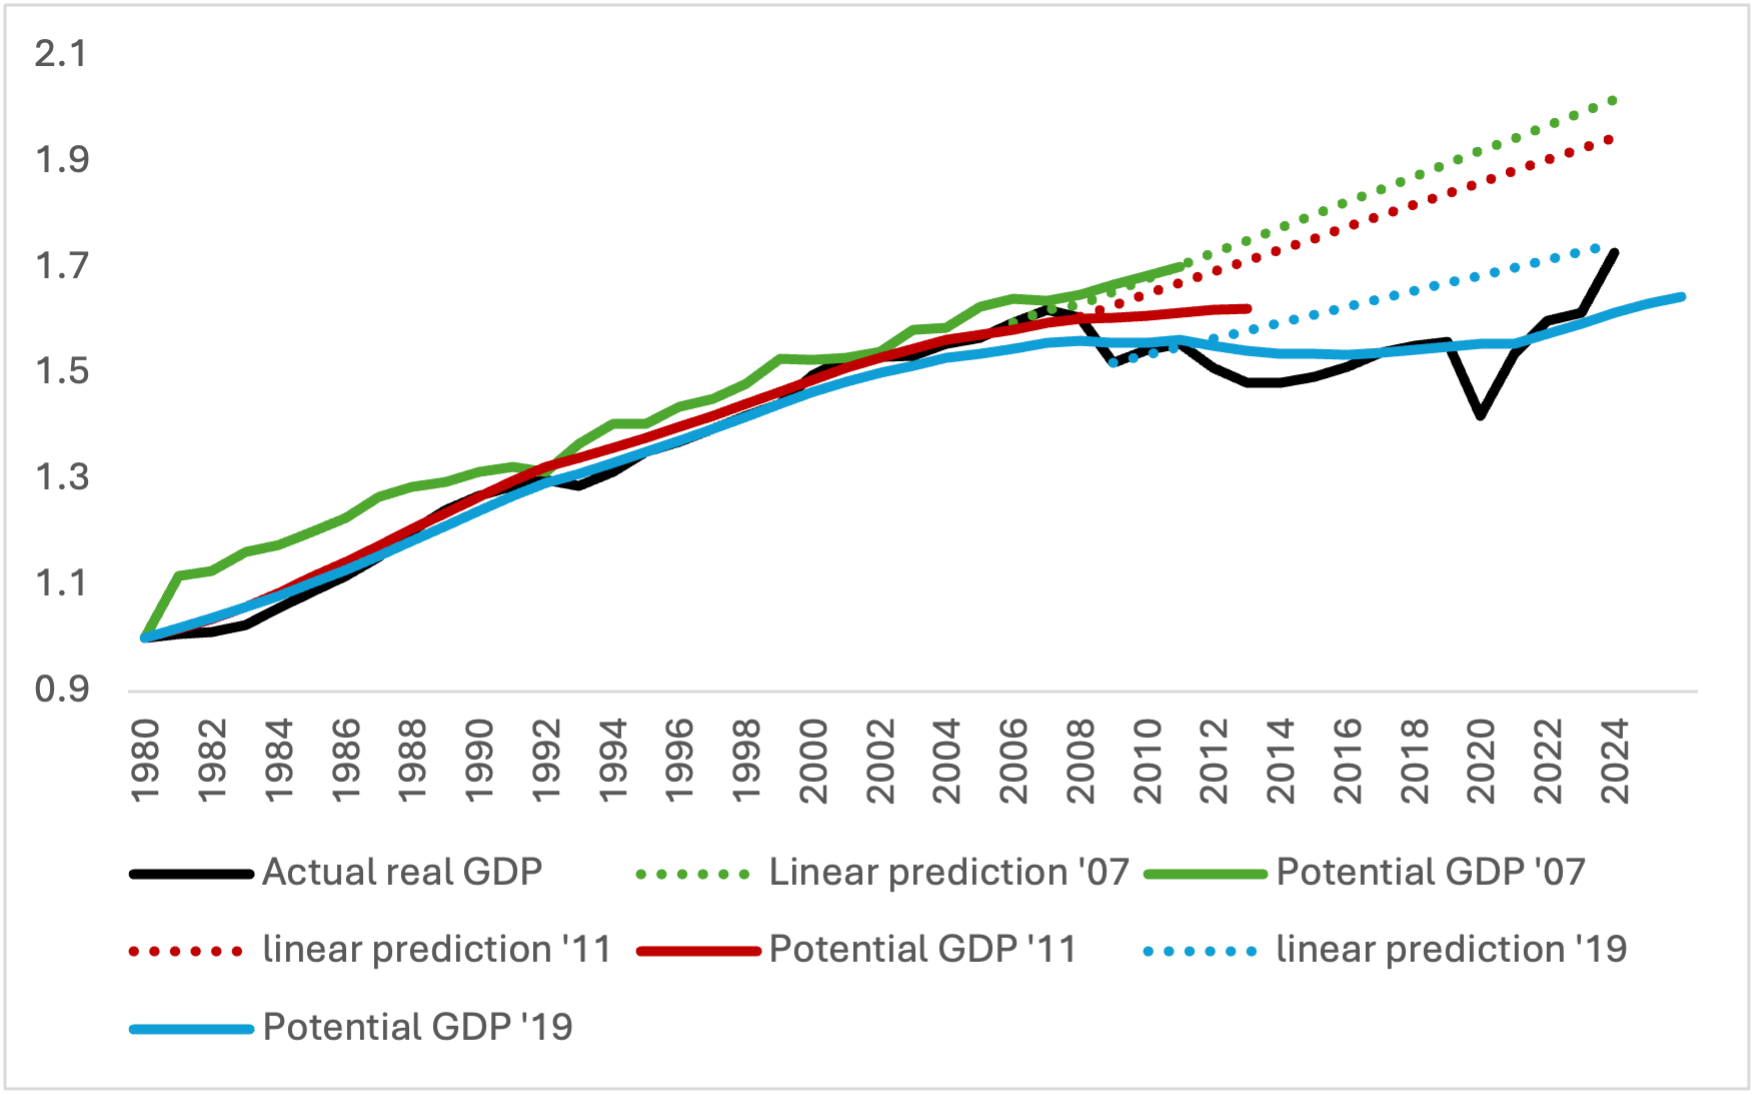
Figure 1: Gross Domestic Product (GDP) in Italy: actual data, linear projections, and OECD estimates of potential output (logarithmic scale). The dashed lines represent linear projections based on three different subsamples: 1980–2007, 1980–2011, and 1980–2019. The potential output series for 2011 and 2019 are from AMECO, while the 2007 series is taken from the IMF’s World Economic Outlook (2007).
It should also be noted that the 2011–13 consolidation coincided with an increase in the debt-to-GDP ratio of about 15 percentage points, which remained high in subsequent years (Figure 2), confirming that “the consolidation policies of those years were self-defeating” (Fatás and Summers, 2018, p. 248).
Finally, Italy’s weak growth since the mid-1990s can also be attributed to a regime of “permanent austerity”: between 1992 and 2019, Italy recorded consistent primary surpluses, with public spending growth much slower than elsewhere in the Eurozone and a widening divergence from other major European economies (Heimberger, 2024 and 2025; Schuberth, 2024, Storm, 2019).
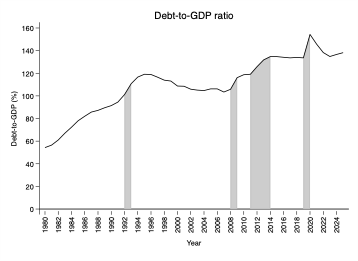
Figure 2. Debt-to-GDP ratio in Italy. The gray areas indicate periods of recession. Data source: AMECO
The policy implications of these considerations are significant: since recessions and fiscal consolidations leave permanent scars on economies, while expansions, conversely, have persistent positive effects (Girardi et al., 2020; Paternesi Meloni et al., 2022; Di Domenico et al., 2023), macroeconomic policy should aim to maintain economic activity at high levels (Cerra et al., 2023) rather than being blindly oriented toward compliance with budget constraints.
The Commission’s reference to potential output—which is assumed to be independent of aggregate demand but in fact is not—carries a high risk of fueling a recessionary cycle in which constraints on public spending, by slowing actual GDP growth, lead to actual deficits exceeding the 3% limit and the country incurring in the excessive deficit procedure, despite having respected the prescribed net expenditure path. In addition, slower than expected growth leads to lower estimates of potential output, higher estimated structural deficits, and hence calls for further restrictions.
Finally, as suggested above, these rules carry a high risk of being self-defeating with respect to debt-to-GDP reduction. The International Monetary Fund (2023, p. 73) has already argued that, on average, fiscal consolidations do not reduce the debt ratio. For Italy, the Commission itself forecasts that the implementation of the proposed policies will lead to an increase in the debt-to-GDP ratio through 2029 due to negative effects on the denominator, even though these effects are underestimated, and the decline in the debt ratio afterwards is entirely based on the assumption of a return to the potential output path.
The Commission uses a fiscal multiplier of 0.75 in these estimates, which is significantly lower than both the average of international estimates (for a survey, see Gechert, 2015) and estimates specific to Italy (Giordano et al., 2007; Deleidi et al., 2021; Deleidi, 2022; Zezza and Guarascio, 2023). With a more plausible multiplier (0.9) and a more protracted dissipation of negative effects over time (5 years), the estimated increase in the debt-to-GDP ratio is much higher (Heimberger et al., 2024). Furthermore, estimates that abandon the assumption of an automatic return to potential output—assuming instead that restrictive policies have permanent effects on GDP—project debt at nearly 152% of GDP in 2029 and over 158% in 2031 (Ciccone, 2025).
The looming scenario—marked by restrictive policies, economic stagnation, and a rising debt-to-GDP ratio—is clearly very dangerous and destabilizing for Italy from financial, economic, and social perspectives.
For these reasons, we propose a shift in perspective: we test the effects, in terms of debt-to-GDP and deficit-to-GDP ratios, of a fiscal policy aimed at achieving a reasonably low and realistic unemployment rate—a goal that, in our view, should guide the definition of national fiscal rules.
4. Assessing the Impact of a Fiscal Policy Aimed at Low Unemployment
Since we want to define a target in terms of the unemployment rate, we must determine what level of GDP growth is necessary to achieve it. To this end, we estimate the relationship between the year-over-year change in the unemployment rate and the real GDP growth rate:
[1] Δu = α − βg
where α represents the change in the unemployment rate that would occur if the GDP growth rate were zero, while β is the so-called Okun coefficient and indicates by how many percentage points the unemployment rate falls for every 1% increase in GDP.
In line with much of the literature (Ball et al., 2017; Carnazza et al., 2023; Uxó et al., 2024), we estimate a dynamic version of this relationship to capture the influence of past real GDP growth on the current change in the unemployment rate. We limit the analysis to a short period (1995–2024) to ensure that the regression is estimated over a time span characterized by common economic features. Furthermore, we test for the presence of structural breaks and identify two, in 2012 and 2020. Consequently, we include two dummy variables in the model, whose coefficients are significant.
Our results indicate a cumulative β coefficient of 0.225, consistent with the estimate in Carnazza et al. (2023).
From Equation 1, we can derive the growth rate required to achieve the desired annual reduction in the unemployment rate (Equation 2), namely:
[2] g = (Δu - α) / (-β)
Therefore, for a one-percentage-point annual reduction in the unemployment rate and considering the estimated values of β and α, the required growth rate is 4.6% per year. We set the unemployment target at 4.5%, a value equal to the lowest male unemployment rate reached in the last decade, specifically in 2007.[1] Although a target of 4.5% may seem very ambitious, since such levels have not been attained for a time, we note that the official definition of employment has evolved over the years to include even those who work only one hour per week, which risks obscuring Italy’s widespread underemployment (Deleidi et al., 2024).[2] It is also important to note that the ratio of unemployed persons to standard work units (i.e., full-time equivalent employment) has worsened in recent years compared to the same ratio calculated based on total employment, mainly due to stagnation in full-time employment.
To achieve the unemployment target of 4.5% by 2029 and considering the actual rate in the first quarter of 2024 was 6.8%, the required annual reduction in the unemployment rate is 0.46 percentage points, achievable provided that real GDP growth is 2.6% per year. The 4.5% target is lower than the level projected in the macroeconomic policy scenario presented by the Ministry of Economy and Finance (MEF, 2024, p. 43) for 2029 (6.3%) and is clearly lower than that estimated by the IMF (Fiscal Monitor, April 2024) for the period 2024–2029 (8.3%). At the same time, the required real GDP growth rate is also higher than that expected by the institutions, which fluctuates around values between 0 and 1, both in the European Commission’s scenario and in the MEF’s.
We then proceed to determine the necessary increase in public spending (G) to achieve the target growth rate, on the basis that output is demand-driven not just in the short run but also in the long run (Cesaratto 2015 and Stirati 2025 provide surveys of the analytical and empirical background of this proposition). Since economic growth is not driven exclusively by public spending, we subtract the contributions of the other components of aggregate demand from the growth rate required to reach the target. The remaining portion, calculated as the residual, will represent the share of growth that must be supported by public spending. In line with the methodology proposed by Girardi and Pariboni (2016) and extended by Spinato Morlin et al. (2024),[3] we define autonomous investment as residential investment, while for autonomous consumption we refer to consumer credit (for details on the calculation methods, and other technical details see Romaniello and Stirati 2026). To calculate the contributions to GDP growth provided by these components, we consider the growth forecasts provided by the MEF in the 2025–2029 Medium-Term Structural Budget Plan.[4] These projections allow us to isolate the residual growth component, which should be covered by public spending. In other words, this residual identifies the share of GDP growth that must be supported by fiscal policy
Once we have calculated the growth rate that must be induced by public spending, we determine the total amount of public spending and its share of GDP by applying the fiscal multiplier arithmetic (μ), as described in Equation 3.
[3] ΔG = ΔGDP / μ
Next, using the projected levels of nominal GDP, we estimate total public revenue by applying the revenue-to-GDP ratio from the AMECO dataset through 2026, the year in which it reaches 47.9%, and assume that this ratio remains constant in subsequent years. Furthermore, to analyze the evolution of public debt, we consider two interest rate scenarios: one based on the European Commission forecasts accompanying the Debt Sustainability Monitor 2023 (European Commission, 2024), and the other aligned with the macroeconomic policy framework jointly agreed upon by the Ministry of Economy and Finance and the European Commission (MEF, 2024).
5. Various Scenarios of Expansionary Fiscal Policy
As a first scenario, we consider a policy oriented towards our unemployment target and adopt a prudent approach, using the European Commission’s fiscal multiplier of 0.75. Next, we consider a scenario with a multiplier of 1, followed by a third scenario that uses a higher multiplier of 1.409, as estimated by Deleidi et al. (2021). We then compare our calculations with the adjustment scenario projected by the European Commission in the Debt Sustainability Monitor 2023.[5] In all scenarios, unlike the European Commission’s forecasts and in line with the scientific literature, we do not assume any automatic mechanism for the convergence of actual GDP toward potential GDP; we therefore assume that persistent changes in the level of public spending generate persistent changes in the level of GDP, the magnitude of which depends on the fiscal multiplier, while keeping the Commission’s data and forecasts for other relevant variables.
The real GDP growth rate projected in our scenario, set at 2.6% annually between 2024 and 2029, significantly exceeds the estimates provided by the European Commission (EC) and also those expected by the Italian Ministry of Economy. The evolution of public spending, combined with the assumption of a constant share of government revenue and higher GDP growth, results in a gradual improvement in the general government net balance as a percentage of GDP. As shown in Table 1, by 2029 our projections indicate a deficit of -2.7%, which is more favorable than the EC’s estimate of -3.5%.
Table 1. Total net public deficit, % of GDP. Various scenarios
Years | |||||||
Source | Scenario | 2024 | 2025 | 2026 | 2027 | 2028 | 2029 |
European commision | Official Forecast | -4.4 | -4.3 | -4.4 | -4.2 | -3.9 | -3.5 |
Own simulation | EC multiplier (0.75) | -7.3 | -6.1 | -5.0 | -3.7 | -3.2 | -2.7 |
Multiplier=1 | -6.9 | -5.3 | -3.8 | -2.3 | -1.4 | -0.6 | |
Keynesian multiplier (1.409) | -6.5 | -4.5 | -2.7 | -0.9 | 0.2 | 1.3 |
The first row shows the total deficit-to-GDP ratio projected by the European Commission, as presented in the Medium-Term Fiscal Structural Plan (MEF, 2024, p. 22). Rows 2–4 show the deficit-to-GDP ratios obtained from our simulations, based on different fiscal multiplier assumptions.
Figure 3 illustrates the evolution of the debt-to-GDP ratio. Overall, our simulations show steeper trajectories compared to the European Commission’s forecasts. However, these results are highly sensitive to the value assigned to the fiscal multiplier. Using a multiplier below 1 tends to overestimate the amount of public spending needed to achieve a given growth target. In the first scenario, with the multiplier set at 0.75 and using the interest rate forecasts from the Ministry of Economy and Finance (MEF), the debt-to-GDP ratio reaches 151.8% in 2029, compared to the EC’s projection of 139.7%. Under the Debt Sustainability Monitor’s (DSM) most pessimistic interest rate assumptions, the ratio rises to 153.8%. The reduction in public deficits as a share of GDP below the Commission’s forecast, even in this scenario, suggests, however, that the debt trajectory would tend to decline over longer horizons. It should be noted, in any case, that the results obtained in the Commission’s projections depend crucially on the assumption that the negative effects of fiscal consolidation on GDP will “fade away.” With the same restrictive policy, but without this assumption, the debt-to-GDP ratio would increase, likely beyond what is projected in our expansionary scenario (see Ciccone, 2025).
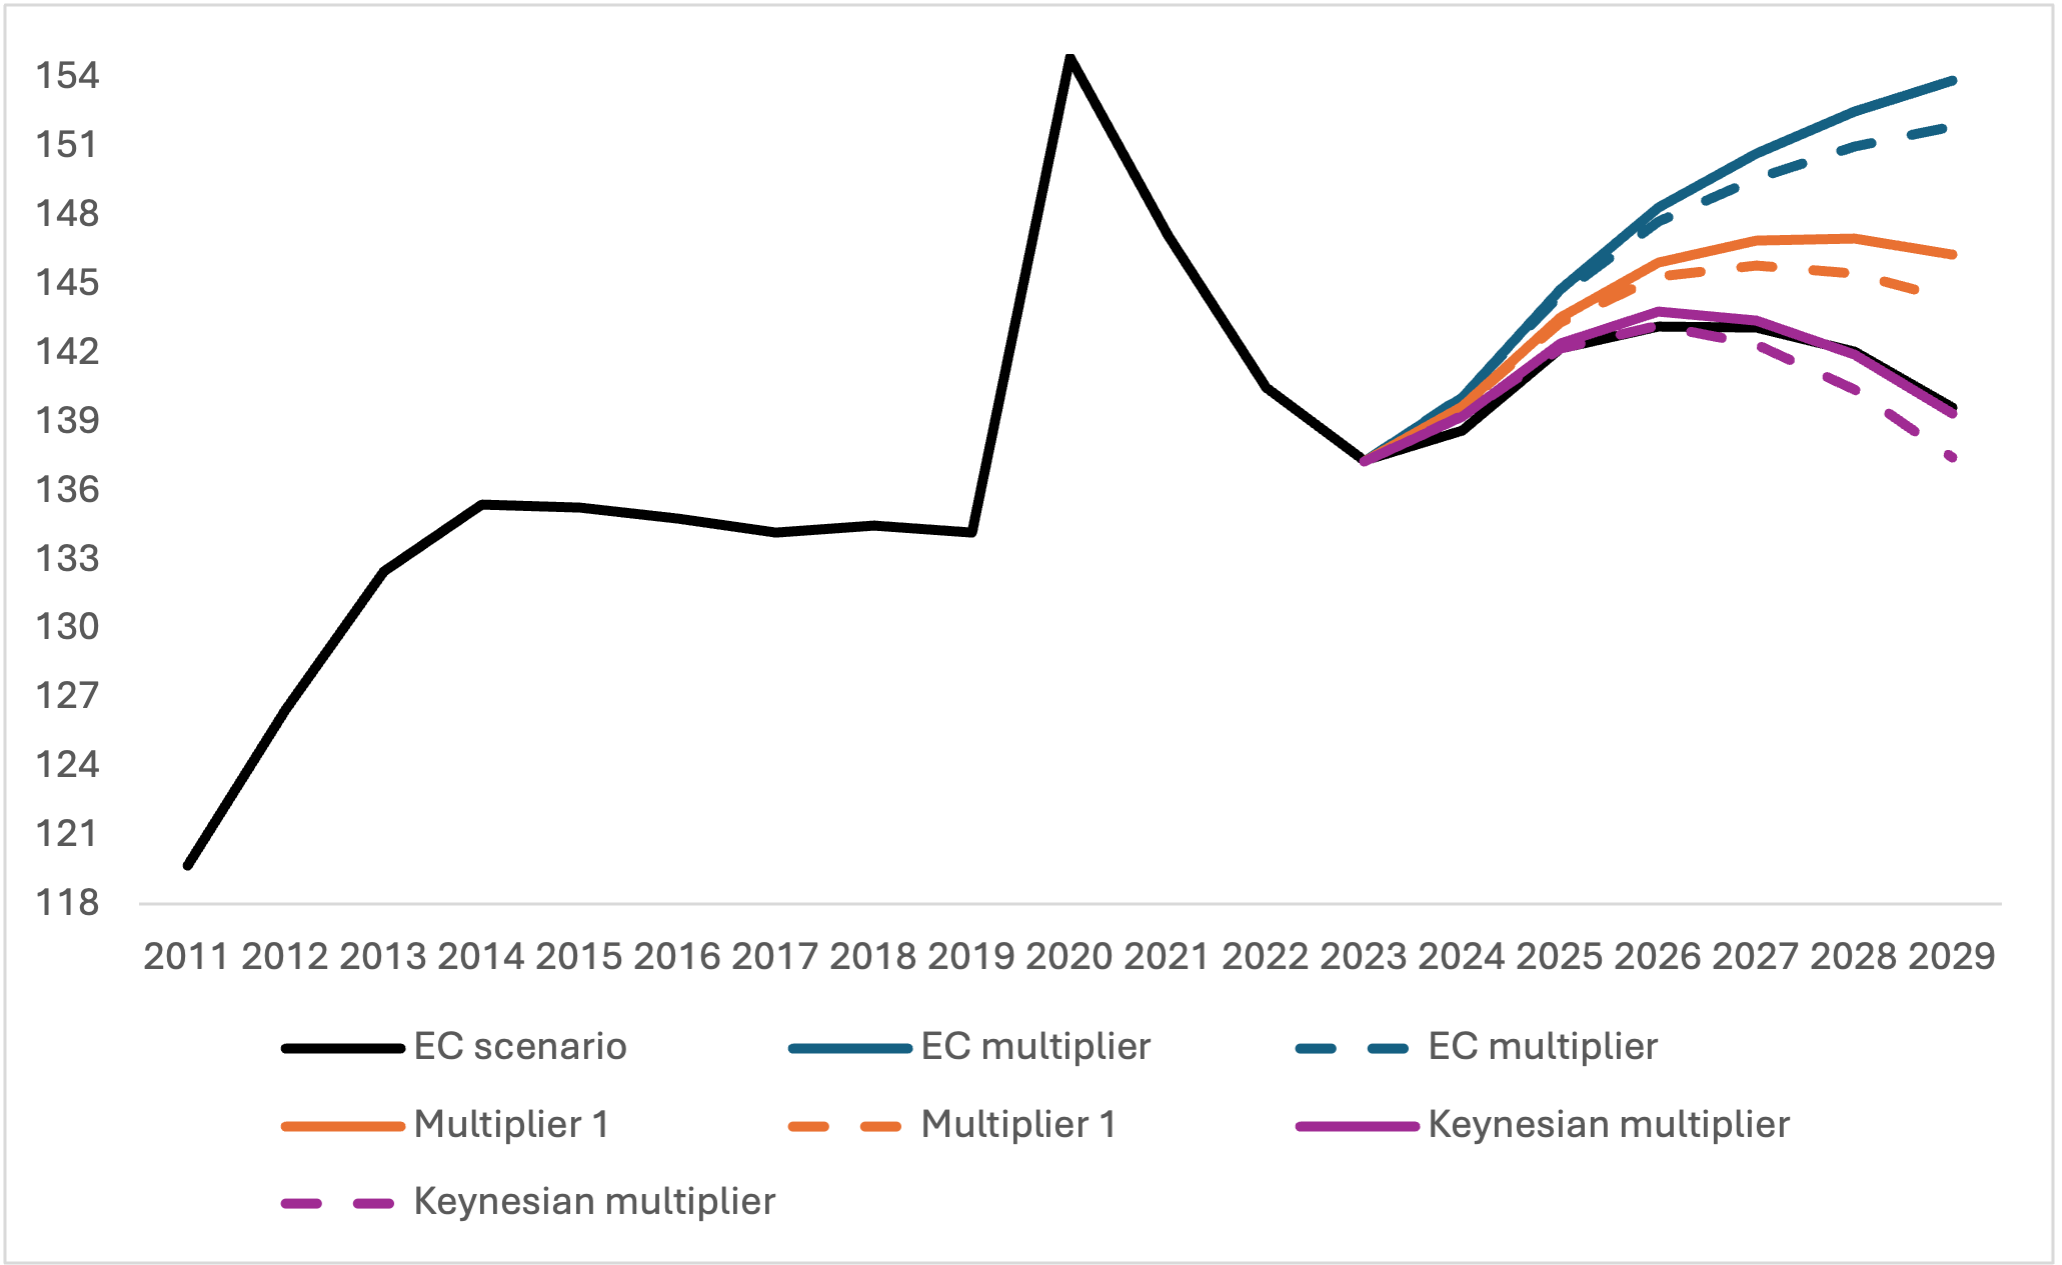
Figure 3. Gross public debt as a percentage of GDP. European Commission forecasts compared with our projections based on the three fiscal multiplier scenarios.
The black line represents the European Commission’s adjustment scenario. The blue line corresponds to our simulation with a fiscal multiplier of 0.75, consistent with the Commission’s assumption; the orange line reflects a scenario with a multiplier of 1; the purple line is based on a Keynesian multiplier of 1.409. Each scenario is simulated under two interest rate assumptions: the solid lines refer to the Commission’s projections (DSM), while the dashed lines reflect the MEF’s forecasts (data sources are detailed in Romaniello and Stirati 2026).
As the Figure suggests, an increase in the fiscal multiplier introduces notable changes in both deficit and debt outcomes. With a multiplier of 1, as adopted by the MEF in the 2017 Update to the Economic and Financial Document (NADEF), the general government net balance as a percentage of GDP clearly improves by 2029. In this scenario, the debt-to-GDP ratio reaches 143% under the MEF’s interest rate assumptions and 146% under the DSM projections (see the orange lines in Figure 8). Although slightly higher than the EC’s estimate, the trajectory remains stable and not explosive, showing a downward trend as the effects of higher growth unfold.
Finally, adopting the average fiscal multiplier for Italy estimated by Deleidi et al. (2021) at 1.409, the results improve further. The need for high public spending gradually decreases, with public spending as a share of GDP falling to 46.6% by 2029. Meanwhile, the general government net balance turns into a surplus as early as 2028. As shown by the purple lines in Figure 8, the debt-to-GDP ratio closely aligns with the EC’s official estimate when using the same interest rate assumptions (139.37% in 2029) and falls even further to 137.46% in the MEF scenario. These results confirm that—in addition to the value of the fiscal multiplier—the evolution of the debt-to-GDP ratio is significantly determined by monetary policy and by interest rate dynamics, as shown also by the Commission’s Economic Forecasts (2024).
6. Conclusions
We have discussed the shortcomings of the “new” European rules, both in general and as they apply to the Italian economy, highlighting the unrealistic assumptions underlying these rules and how they risk leading Italy (and/or other countries) into a dangerous situation of stagnation or recession, accompanied by a worsening of the debt-to-GDP ratio. In light of this, this paper estimates the fiscal implications of a policy aimed at achieving a low unemployment rate. In practice, this amounts to modifying ‘potential output’ from the very controversial and problematic current measurement to one based on a reasonable policy target in terms of unemployment.
For the Italian economy, we analyze scenarios related to a target of 4.5% unemployment rate, a realistic yet ambitious target that requires annual GDP growth of 2.6% over the 2024–2029 period. To underscore the importance of expansionary fiscal and monetary policies we explored various scenarios adopting as much as possible the data and assumptions contained in the forecasts of the European Commission and the Ministry of Economy and Finance. However, unlike these institutions and in line with the scientific literature, the effects of changes in public spending on GDP were considered permanent. Using the fiscal multiplier suggested by the European Commission (0.75), the deficit-to-GDP ratio decreases more than in the Commission’s policy scenario, but the debt-to-GDP ratio in 2029 exceeds the level projected by the European Commission and the Ministry of Economy and Finance in the 2025–2029 Medium-Term Structural Budget Plan, which, however, is calculated under the unsupported and unrealistic assumption of a rapid dissipation of the negative effects of consolidation. The assumption of persistent effects and higher fiscal multipliers—equal to or greater than 1, as suggested by findings in academic and institutional literature—produces different outcomes. Among these, in addition to a substantially lower unemployment rate than institutional forecasts, it is important to note that the debt-to-GDP ratio decreases by the end of the period and, particularly in the “Keynesian” scenario, falls close to or below the official projections based on restrictive macroeconomic policies.
These results are consistent with recent analyses highlighting how restrictive fiscal policies can have adverse effects on the debt-to-GDP ratio (Ciccone, 2013; Fatás and Summers, 2018; Ciaffi et al., 2019; Heimberger et al., 2024) and how expansionary fiscal policies can enhance debt sustainability (Ciaffi et al., 2024; Uxó et al., 2024). Naturally, there is a degree of uncertainty surrounding all forecasts, as well as estimates of multipliers. Our simulation exercises help to demonstrate the sensitivity of the projections to alternative assumptions. However, the large number of studies indicating that fiscal consolidations can result in “permanent scars” suggests that it is preferable to err in the opposite direction, toward expansion. This contrasts with what is happening: in the 2026 budget policy document, the Ministry of Economy and Finance projects average growth in net public spending over the 2026–28 period to be lower than the projected growth in prices, and thus negative in real terms.
A policy focused on reducing the unemployment rate would have clear economic and social benefits, producing effects on the public budget that are not catastrophic—and likely virtuous in the medium term. Such a policy shift should therefore be seriously considered by European governments and regulators, in light of the multiple risks—not only economic, but also social, political, and financial—associated with pursuing the painful and likely self-defeating policy of fiscal austerity.
References
Ball, L., & Onken, J. (2022). Hysteresis in unemployment: Evidence from OECD estimates of the natural rate. International Finance, 25(3), 268-284.
Ball, L., Leigh, D., & Loungani, P. (2017). Okun’s law: Fit at 50? Journal of Money, Credit and Banking, 49(7), 1413–1441.
Blanchard, O., Cerutti, E., & Summers, L. (2015). Inflation and activity–two explorations and their monetary policy implications (No. w21726). National Bureau of Economic Research.
Carnazza, G., Fontanari, C., Liberati, P., & Palumbo, A. (2023). From Potential GDP to Structural Balance: A Theoretical Reassessment and New Evidence for Italy. Review of Political Economy, 35(2), 510-540.
Cerra, V., Fatás, A., & Saxena, S. C. (2023). Hysteresis and business cycles. Journal of Economic Literature, 61(1), 181-225.
Cesaratto S., (2015). Neo-Kaleckian and Sraffian Controversies on the Theory of Accumulation, Review of Political Economy, vol. 27(2), pages 154-182, April. http://hdl.handle.net/10.1080/09538259.2015.1010708
Ciaffi, G., Deleidi, M., & Levrero, E. S. (2019). An estimate of the macroeconomic effects of the Fiscal Compact. Economia e Politica, 17(1), 1–12. https://www.economiaepolitica.it/2019-anno-11-n-17-sem-1/fiscal-compact/
Ciaffi, G., Deleidi, M., & Di Domenico, L. (2024). Fiscal policy and public debt: Government investment is most effective to promote sustainability. Journal of Policy Modeling, 46(6), November–December 2024, 1186–1209. http://www.sciencedirect.com/science/article/pii/S0161893824001005
Ciccone, C. (2025). Debt, Austerity, and the New EU Rules: Why Italy’s “Reform” Path Still Leads Nowhere, Institute for New Economic Thinking (INET), November. https://www.ineteconomics.org/…
Ciccone, R. (2013). Public debt and aggregate demand: some unconventional analytics, in Levrero E.S., Palumbo A., Stirati A., Sraffa and the Reconstruction of Economic Theory, Vol. 2: Aggregate demand, Policy Analysis and Growth, Palgrave Macmillan. http://digamo.free.fr/sraffar32.pdf
Deleidi, M. (2022) Quantifying multipliers in Italy: does fiscal policy composition matter?, Oxford Economic Papers, Volume 74, Issue 2, April 2022, Pages 359–381.
Deleidi, M., Romaniello, D., & Tosi, F. (2021). Quantifying fiscal multipliers in Italy: A Panel SVAR analysis using regional data. Papers in Regional Science, 100(5), 1158-1178. https://doi.org/10.1111/pirs.12620
Deleidi, M., Romaniello, D., Salvati, L., & Tosi, F. (2024). Wage and fiscal policy re-examined. An assessment of employment and productivity using Italian regional data. International Journal of Manpower.
Di Domenico, L., Gahn, S. J., & Romaniello, D. (2024). Testing the Waters of Positive Hysteresis: The Effects of Autonomous Demand Shocks on Inflation, Accumulation, and Labor in the US Economy (No. CSWP64). “Piero Sraffa” Research and Documentation Center. https://www.centrosraffa.org/p…
European Commission (2024), Debt Sustainability Monitor 2023, Institutional Paper 271, March. https://economy-finance.ec.eur…
Europea Commission (2024) Commission prior guidance calculation sheet: Italy, June, https://economy-finance.ec.eur…
European Fiscal Board (2019) Assessment of EU fiscal rules with a focus on the six- and two-pack legislation, August. https://commission.europa.eu/system/files/2019-09/2019-09-10-assessment-of-eu-fiscal-rules_en.pdf
Fatás, A., & Summers, L. H. (2018). The permanent effects of fiscal consolidations. Journal of International Economics, 112, 238–250. http://www.sciencedirect.com/science/article/pii/S0022199617301411
Freitas, F. N., & Dweck, E. (2013). The pattern of economic growth of the Brazilian economy 1970–2005: a demand-led growth perspective. In Sraffa and the Reconstruction of Economic Theory: Volume Two: Aggregate Demand, Policy Analysis and Growth (pp. 158–191). London: Palgrave Macmillan UK. https://www.researchgate.net/p…
Furlanetto, F., Lepetit, A., Robstad, Ø., Rubio-Ramírez, J., & Ulvedal, P. (2025). Estimating hysteresis effects. American Economic Journal: Macroeconomics, 17(1), 35–70. https://www.aeaweb.org/doi/10….
Gechert, S. (2015). What fiscal policy is most effective? A meta-regression analysis. Oxford Economic Papers, 67(3), 553–580. https://doi.org/10.1093/oep/gpv027
Giordano, R., Momigliano, S., Neri, S., & Perotti, R. (2007). The effects of fiscal policy in Italy: Evidence from a VAR model. European Journal of Political Economy, 23(3), 707-733. http://www.sciencedirect.com/s…
Girardi, D., & Pariboni, R. (2016). Long-run effective demand in the U.S. economy: an empirical test of the Sraffian supermultiplier model. Review of Political Economy, 28(4), 523–544. http://hdl.handle.net/10.1080/…
Girardi, D., Paternesi Meloni, W., & Stirati, A. (2020). Reverse hysteresis? Persistent effects of autonomous demand expansions. Cambridge Journal of Economics, 44(4), 835-869. http://hdl.handle.net/10.1093/…
Guarascio, D., Heimberger, P., & Zezza, F. (2025). The Eurozone’s Achilles Heel: Reassessing Italy’s Long Decline in the Context of European Integration and Globalization. Italian Economic Journal. https://doi.org/10.1007/s40797….
Heimberger, P. (2023). Debt sustainability analysis as an anchor in EU fiscal rules. Economic Governance and EMU Scrutiny Unit (EGOV), Directorate-General for Internal Policies, PE 741.504 – March 2023. https://www.europarl.europa.eu…
Heimberger, P. (2024). Italy’s decline: A critical reassessment of prevailing explanations. The Political Economy of Italy and the Centre-Periphery Perspective on Europe, Glassmann, U, Gräbner-Radkowitsch, C. (Eds.), Ökonomie und Gesellschaft, 35, 25–48. https://www.metropolis-verlag….
Heimberger, P. (2025). Fiscal consolidation and its growth effects in euro area countries: past, present, and future outlook. Review of Evolutionary Political Economy https://doi.org/10.1007/s43253…
Heimberger, P., Welslau, L., Schütz, B., Gechert, S., Guarascio, D., & Zezza, F. (2024). Debt sustainability analysis in reformed EU fiscal rules. The effect of fiscal consolidation on growth and public debt ratios. Intereconomics, 59(5), 276–283. https://doi.org/10.2478/ie-2024-0055
International Monetary Fund (2023) World Economic Outlook, Chapter 3: Coming down to earth - how to tackle soaring public debt, Washington, DC, April. https://bit.ly/3KxfRDJ
Levrero E.S., Pariboni R., & Romaniello, D. (2023) (eds.) ASTRIL Report 2022: Labor Market, Bargaining, and Wages in Italy: 1990–2021, Rome: TrE Press. (ISBN 979-12-5977-199-5) https://romatrepress.uniroma3….
Ministero dell’economia e Finanza (MEF), (2017), Aggiornamento al documento di Economia e Finanza, September. https://www.mef.gov.it/focus/DEF-2017-00001/
Ministero dell’economia e Finanza (MEF) (2024) Medium-term fiscal-structural plan – Italy 2025-2029, September https://www.governo.it/it/node/26684
Okun, A. M. (1962). Potential GNP: Its measurement and significance. Proceedings of the Business and Economics Statistics Section of the American Statistical Association, pp. 98–104.
Paternesi Meloni, W., Romaniello, D., & Stirati, A. (2022). Inflation and the NAIRU: assessing the role of long-term unemployment as a cause of hysteresis. Economic Modelling, 113, 105900.
Romaniello D. & Stirati A. (2026). Potential output versus target unemployment in the EU fiscal framework: implications for the Italian economy of a change in perspective. Review of Evolutionary Political Economy, Springer, vol. 7(1), pages 1-26, December.
Schuberth, H. (2024). The European Union’s new risk-based framework for fiscal rules–overly complex, opaque and self-defeating. Institute for New Economic Thinking (INET), March. https://www.ineteconomics.org/…
Serrano, F. (1995). Long-period effective demand and the Sraffian supermultiplier. Contributions to Political Economy, 14(1), 67–90.
Spinato Morlin, G., Passos, N., & Pariboni, R. (2024). Growth theory and the growth model perspective: insights from the supermultiplier. Review of Political Economy, 36(3), 1130-1155.
Stirati A. (2025). Beyond the NAIRU, Review of Keynesian Economics, Issue 1, Vol. 13.
Storm, S. (2019). Lost in Deflation: Why Italy’s Woes Are a Warning to the Whole Eurozone. International Journal of Political Economy, 48(3), 195–237. https://doi.org/10.1080/089119…
Uxó, J., Febrero, E., Ayala, I., & Villanueva, P. (2024). Debt sustainability and policy targets: Full employment or structural balance? A simulation for the Spanish economy. Structural Change and Economic Dynamics, 69, 475–487.
Zezza, F., & Guarascio, D. (2023). Fiscal policy, public investment, and structural change: A p-SVAR analysis on Italian regions. Regional Studies. https://doi.org/10.1080/00343404.2023. 2251533
- 1. [1] Although this is, in a sense, a discretionary choice, several considerations underpin this target: first, at that unemployment rate, the economy showed no signs of overheating or inflation; and given the dominance of the male workforce in the labor market and a certain degree of gender segmentation, we can assume that extending that rate to the entire labor market would not be inflationary. Secondly, for our analysis to be meaningful in showing the trend of fiscal variables under alternative policies, the target must be significantly lower than the current unemployment rate and imply a significant shift in policy direction.
- 2. [2] Nevertheless, to ensure comparability with European Commission data, we have decided to continue relying on the standard unemployment rate rather than alternative indicators such as the U6 measure, which includes the unemployed, the underemployed, and the potential labor force. Note, however, that the U6 unemployment rate for Italy stands at around 20%, down from previous years but still a decidedly high figure (for further details, see the 2022 Astril Report edited by Levrero et al., 2023).
- 3. [3] This methodology for calculating contributions to growth is therefore theoretically sound, insofar as it assumes the validity of the supermultiplier growth model. By contrast, the use of traditional ex post accounting decompositions of growth would not allow for the identification of the components that actually determine and stimulate economic growth, limiting itself to describing how any growth that may have occurred is distributed among the various components of aggregate demand. For our analysis, this approach would imply the need for a lower level of public spending to achieve the desired growth rate—a conclusion that is incorrect in light of the now well-established empirical evidence that the autonomous components of demand play a decisive role in the growth process.
- 4. [4] We adopt the growth rates projected by the MEF for exports. For autonomous consumption and autonomous investment, we apply the MEF’s projections for private final consumption and private investment, respectively. We are aware that using the MEF’s forecasts on the growth rate of private final consumption to estimate autonomous consumption, and its forecasts on private investment to estimate autonomous investment, may appear to be a significant simplification. However, our main objective is to isolate the contribution to growth attributable to these components, so as to calculate the residual attributable to public spending. Given the limitations of the available data and our intention to minimize further assumptions, we have chosen, where possible, to rely on institutional forecasts. With regard to private investment, this approach is broadly consistent with historical trends: between 2000 and 2012, the growth rates of private and residential investment moved in close correlation. As for autonomous consumption, we consider the choice to be conservative. Eurostat data show that growth in household durable goods consumption has typically exceeded that of total private final consumption. Therefore, using the latter as a proxy for credit-financed consumption provides a prudent and conservative estimate.
- 5. [5] We take as our reference the Commission’s forecasts and guidance, rather than the adjustment plan subsequently agreed upon with the government. For our purposes, this is sufficient to analyze the emerging scenario differences. It should also be noted that the MEF has adopted a lower estimate of the fiscal multiplier than that of the Commission, so that the forecasts are likely even more unrealistic in estimating the negative impact of consolidation.