A comment on Goher-Ur-Rehman Mir and Servaas Storm’s Carbon Emissions and Economic Growth: Production Based vs Consumption-Based Evidence on Decoupling
Introduction
The INET Working Paper by Mir and Storm brings an important new perspective to an old debate: whether economic growth itself may be associated with environmental improvement - in this case specifically reduction of greenhouse gas (GHG) emissions - and if so at what point. They point to the ambiguous nature of current results and highlight the critical importance of considering the question in terms of emissions consumption as well as the traditional production-based accounting.
Based on their data they note that “the gap between CO2 consumed and CO2 produced has widened continuously and rapidly during 1995-2007,” and show that any “peaking point” of emissions disappears beyond the range of existing national wealth levels when analysed on a consumption basis. From this they conclude that any serious response to climate change “has to be organised by deliberate (policy) intervention and conscious change in consumption and production patterns.”
We agree with much of this. In particular, we concur on the importance of considering the consumption perspective, the fact that this may substantially change the conclusions of production-based studies, and on the need for policy to address both consumption and production. However, we note and discuss several major limitations of Mir and Storm’s data analysis:
- Reliance on a single source of data (WIOD): consumption data are complex and there are substantial differences between existing data sets
- Neglect of recent data – their data terminate in 2007, whereas trends following the crises have been very different
- Aggregation across countries, which does not enable the analysis to pick up crucial issues around trends at different stages of development in different economic and technological eras due to different patterns in different groups at different times.
- Bias due to the exceptional carbon-and-trade intensity of Chinese growth, which could be examined directly or indirectly, e.g., by separating analysis of energy consumption from carbon
- Omitted variables: GDP is not the only determinant of pollution; it is possible to add other variables; e.g., Foreign Direct Investment, to capture the pollution heaven hypothesis.
Also in their discussion, Mir and Storm conflate structural change with international spillovers, whereas structural change has major intrinsic elements, for example the growth of services with development or the unsustainability of domestic economic structures, as in Russia in the 1990s and China now.
Data and disaggregated trends
In this Comment we use data assembled in the EC-funded project ‘Carbon Consumption Accounting and Policy’ ( Carbon-CAP). This brings together four international Multi-Region Input-Output (MRIO) datasets (WIOD being one of them) and includes “nowcasting” techniques of the EXIOBASE MRIO (Stadler et al, 2015) to estimate CO2 emissions (of fuel combustion and cement emissions) up to 2014. Moran and Wood (2014) show that even after attempting to control for sectoral GHG data there are substantial differences (5%-30%) in country based consumption related emissions between MRIO datasets. Hence using multi-model results/confidence intervals is necessary when drawing conclusions about consumption based emissions.
To give more sense of the data in ways that separate the geographical and temporal elements of the panel series, Figure 1 shows historical trends for a few major regions, illustrating the trends of per capita emissions (vertical) against wealth (horizontal), including the gap between production (solid lines) and consumption (dotted lines). Amongst industrialised countries not shown are Australia (which rises to US levels), Japan (which largely overlaps the EU-15 trajectory) and the Economies in Transition (which trace a complex path of big reductions in both GDP and emissions, followed by rising GDP with mostly flat emissions). Amongst emerging economies the diagram shows the strikingly different patterns of China, Mexico and Brazil, with India still a much earlier stage.
Figure 1: Production and Consumption CO2 emissions and GDP (per-capita)
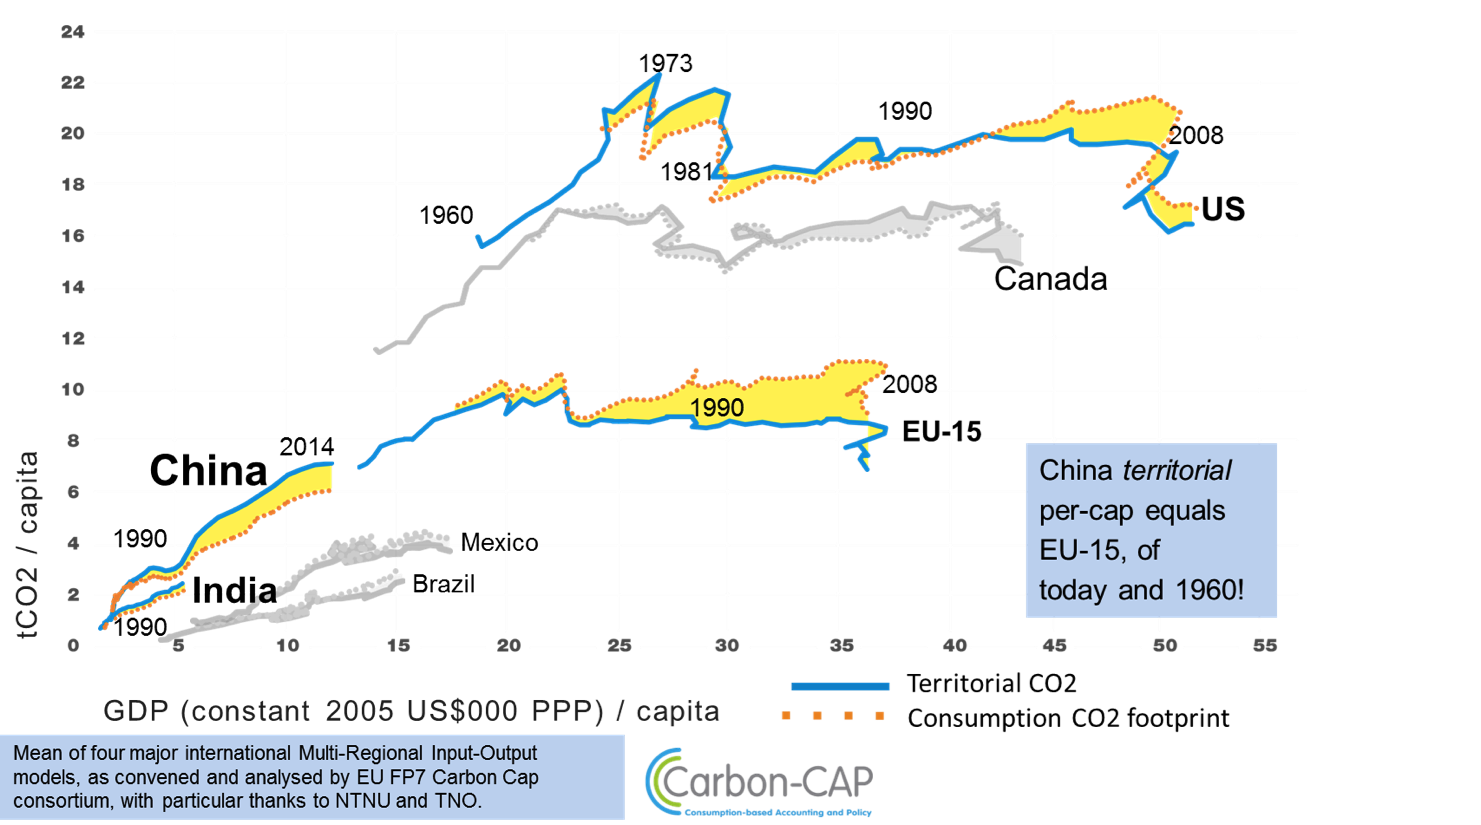
Source: Authors, developed from presentation in The Economist, forthcoming in Wood et al., 2016, using Carbon Cap data (Wood, Stadler & Schmidt, 2016).
The broad qualitative conclusion of Mir and Storm concerning the production-consumption gap is apparent for the quarter-century 1981-2007 (i.e., after the 1970s oil price shocks and associated recession). Over this period, per capita CO2 emissions rose little if at all in most of the advanced industrialised countries on a production basis, but consumption emissions rose steadily (Canada was an exception being somewhat the other way round).
Recent trends
The most recent data raise a significant qualification to this. The seven years since onset of the financial crisis (in this data) saw a large drop in emissions along with almost static per-capita GDP. Moreover, the reduction in consumption emissions has exceeded that in production – the recession particularly hit imports in the US and Europe. From the recession to 2014, there is no sign of increase in emissions in either US or Europe as economies have started to recover, and the overall the gap between production and consumption accounting has declined.
There are of course varied reasons for this, which include a lagged impact of high global energy prices, shale gas in the US, and clean energy policies (efficiency and renewables) in both US and Europe. We do not dispute the qualitative policy conclusion of Mir and Storm, that policies are essential. Indeed, this reflects the old debate about Environmental Kuznets Curves, namely the risk of them being misinterpreted as an indication of autonomous economic trends, when they are actually illustrating the impact of tougher environmental policies as countries develop.
Amongst the emerging economies, the Chinese trajectory was one of explosive growth in the economy and emissions, with production emissions outstripping its consumption due to the large role of carbon-intensive manufacturing for exports. However, not all economies in transition share China’s and India’s pattern of increasing production emissions. For example, in Mexico and Brazil consumption based emissions are higher than production ones. The most recent data also suggest a halt in growth of Chinese (production) emissions in 2014 and 2015. A more extensive review of Chinese historical trends and prospects, moreover, underlines the fundamental mistake of many models in ignoring the effects of structural change, and failing to distinguish between infrastructure investment flows and cumulative stock in the development process (Grubb et al., 2015).
All this emphasises that GDP is not the only determinant of per capita CO2 emissions and EKC analysis needs to include other variables (see more on EKC in Anger and Barker, 2015).
On aggregation, path dependence and the confusion of structural change with spillovers and carbon leakage
The huge difference between developing, emerging and fully industrialised countries underlines a statistical problem in all analyses that simply aggregate countries across time and geographies. A single polynomial equation is derived from an apparently well-populated dataset. Yet the main issue for which conclusions are drawn is an extrapolation towards areas in which there are hardly any data at all. Many of the EKC studies in the literature to which Mir and Storm refer are dominated by poorer countries, and earlier stages of development, yet extrapolate to peaks at far higher levels.
Mir and Storm contain this problem by only analysing 40 countries over limited period (1995-2007), predominantly more industrialised ones at mid and latter stages of development. Yet there remains the concern that most of the data points used to estimate the equations lie at lower levels (their Figure 3), far below the derived peaking, which occurs at far higher income levels. Indeed a closer look at their own scatter results questions their assertion that for consumption emissions “the correlation appears to be a linear one”, for there is negligible relationship within the higher income levels of interest. In fact in all, between the various sets of data it is unclear whether there is any very statistically robust emissions relationship for incomes above about $20,000/capita.
To underline our point we illustrate two quite different countries, not shown in Figure 1. Figure 2 shows the evolution over time of emissions from two industrialised countries – Russia and France (the Russian economic development has been so unstable that a plot against per-capita GDP is almost unintelligible). In France (whose per-capita GDP tracks quite well the EU-15 average) there has indeed been a considerable and (until 2008) growing wedge between production and consumption emissions. However both have declined from peaks in the 1970s as the economy has doubled. This is due not only to France’s nuclear programme, but to exceptional levels of efficiency in its buildings and transport sectors, aided by the rise of its high speed train system. Even consumption emissions are now below 8 tCO2 per capita, at income level of $38,000 per capita – well under half the per capita emissions seen in the US at the same level of income (around 1990).
Russian data (on both emissions, and GDP expressed in $) have considerable uncertainties prior to about 1990 but it is clear there was a huge excess of production over consumption emissions. Both declined with economic contraction after 1990, and have substantially converged. Yet even on a consumption basis emissions have not returned to former levels as the economy has doubled, and remain significantly above those of France, even though French per-capita GDP is at least 50% higher.
Figure 2 - Evolution of production (blue line) and consumption (red line) CO2 emissions (per-capita) in Russia and France (1960-2014)
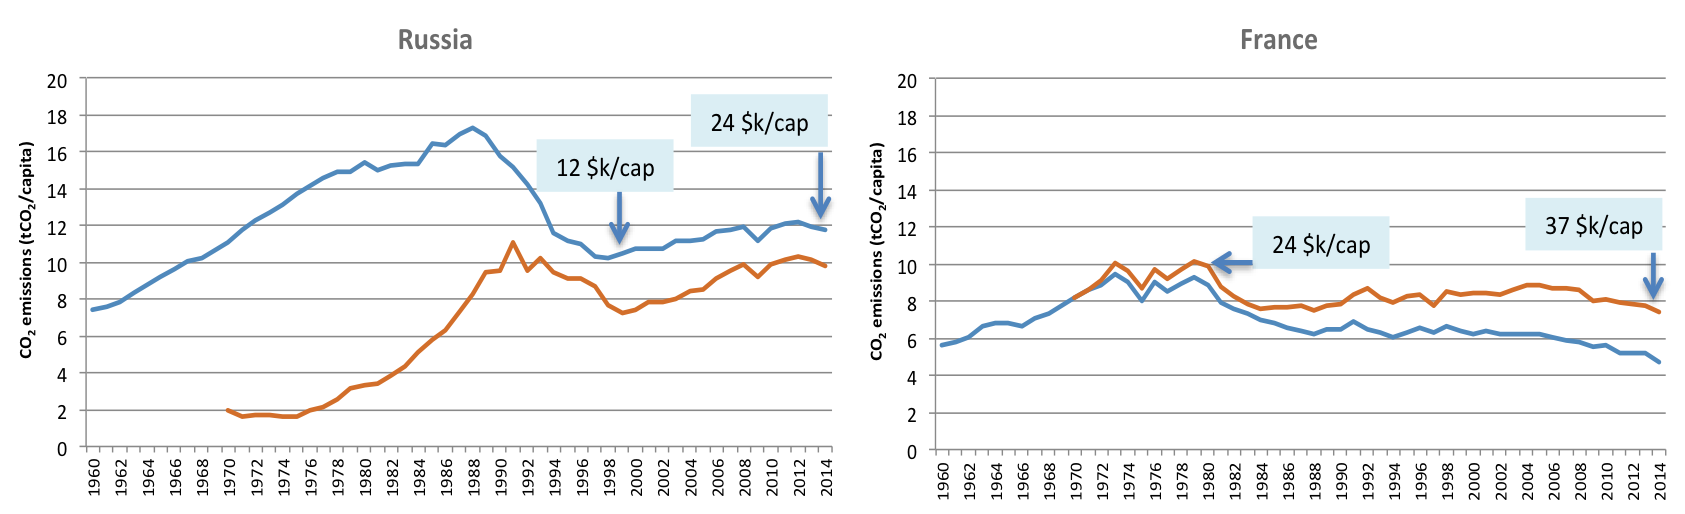
Source: Carbon Cap data in Wood, Stadler & Schmidt (2016)
One key point is that structural change does not necessarily equate to carbon leakage. This is evident from all the data – there is major decoupling of emissions from economic growth whether on production or on consumption basis. This is illustrated in a particularly extreme way through a decomposition of the Russian data (Figure 3). Though since 2000 there has been hardly any change in the wedge between production and consumption (Figure 2), structural change has been the principle factor holding its emissions constant as the economy has almost doubled. Moreover when the economy shrank in 2008-9, the structural change compensated in the opposite direction.\
Figure 3 – Decomposition of Russian data on drivers for annual emission changes
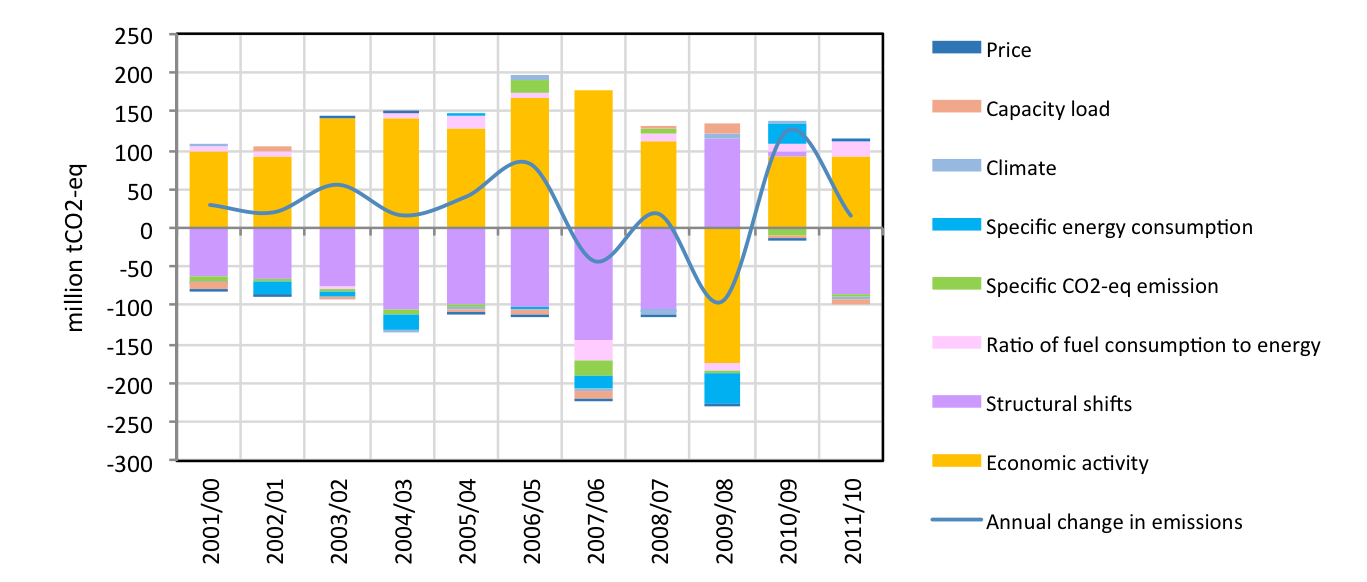
Source: Bashmakov and Myshak (2012)
Overall structural shifts were responsible for 84.1% of the “offsetting” effects; reduction of specific greenhouse gas emissions per unit of fuel, as determined by the growing share of natural gas use, for 4.2%; improved energy efficiency for 8.8%; production capacity load for 2.3%; and the price factor for 0.5%. Compressed in time, the Russian transition underlines simply that as economies mature, more and more of the economic value is associated with lighter manufacturing and the growth of service sectors along with enhanced energy efficiency – none of which is leakage.
The other point is that emission levels depend on historical patterns just as much as wealth - there is high path dependence. Russia’s economy is still burdened by extraordinarily inefficient energy use by comparison with France, which has built on decades of effort in buildings and infrastructure as well as its very low carbon electricity. US infrastructure lies somewhere between, in ways that have little to do with the level of economic development, and everything to do with its historical structure and infrastructure of development.
Finally, and contrary to the suggestion of Mir and Storm, there is no evidence that implementation of the Kyoto Protocol in Europe and the rest of OECD outside North America (with full compliance: see Shishlov, 2016 and Grubb, 2016) caused any leakage. This applies to both micro- and macro- data: in the latter, as noted, the gap between production and consumption in these regions actually declined during the Kyoto Protocol first period commitments (2008-2012) though we would not claim any causal relationship.
Conclusions
Mir and Storm’s analysis raises an important issue – the need for emissions-related analysis to consider consumption as well as production perspectives. They are right that this can substantially change numerical results pertaining to Environmental Kuznets Curve estimation. However, we have explained why such EKC analysis itself is of highly dubious value, and becomes even more so when it is applied to consumption-based extrapolation to predict emission trends as the global economy grows.
Unquestionably, reaching the ambitious goals set out in the Paris Agreement will require strong policies. But if there is one conclusion to be drawn from a more country-specific look at the data, it is that both structural change and policies have already started to have a major impact in many industrialised countries, whilst the highly path-dependent nature of energy and emission trends suggests a huge potential for developing and emerging economies to do far better still.
REFERENCES
- Anger, A. and T. Barker (2015). The Effects of the Financial System and Financial Crises on Global Growth and the Environment. Chapter 5 in P. Arestis, and M. Sawyer (eds.) International Papers in Political Economy: Finance and the Macroeconomics of Environmental Policies, Palgrave Macmillan. London, pp.153-193.
- Bashmakov I.A. and A.D. Myshak (2012). Factors driving Russia’s energy-related greenhouse gas emission. Analysis based on data from the National Inventory Report. – Moscow. Meteoagentstvo Roshydrometa, 2012. (In Russian).
- Grubb, M. (2016). Full legal compliance with the Kyoto Protocol’s first commitment period – some lessons, Climate Policy, doi:10.1080/14693062.2016.1194005.
- Grubb M., Sha F., Spencer T. et al (2015). ‘A review of Chinese CO2 emission projections to 2030: the role of economic structure and policy’, Climate Policy Vol. 15, No. S1, S7–S39, http://dx.doi.org/10.1080/14693062.2015.1101307.
- Moran and Wood (2014). Convergence between the Eora, WIOD, EXIOBASE, and OpenEU’s consumption-based carbon accounts. Economic Systems Research. Vol. 26 (3).
- Shishlov I., R.Morel and V.Bellassen (2016). ‘Compliance of the Parties to the Kyoto Protocol in the first commitment period’, Climate Policy doi: 10.1080/14693062.2016.1164658Wood R. et al. (2016), Forthcoming 2016, www.carboncap.eu
- Stadler, K., R. Wood, M. Simas, T. Bulavskaya, A. de Koning, J. Kuenen, J. Acosta-Fernández, A. Usubiaga, S. Merciai, J. H. Schmidt, M. Theurl, T. Kastner, N. Eisenmenger, S. Giljum, S. Lutter, M. Lieber, H. Wieland and A. Tukker (2016). D5.3 Final report Integrated report on EE IO related macro resource indicator time series. http://fp7desire.eu/documents/category/3-public-deliverables?download=24:d5-3-integrated-report-on-ee-io-related-macro-resource-indicator-time-series.
- Wood, R., K. Stadler and S. Schmidt (2016). Chapter 3: Harmonised emission databases. D 4.1 Limitations of the state of the art in CBCA. Improved and harmonized database for CBCA. S. Giljum. www.carboncap.eu