
Despite fear-mongering about the latest Consumer Price Index, unemployment remains elevated and stimulus is needed to prevent a collapse in demand
With US consumer prices rising at 4.2% on an annual basis in April, the fears of those who have recently been predicting a sharp rise in inflation seem finally to have come true. Shortages of some commodities and some types of labor are fueling the debate about the possibility that inflation has come back to stay, making its way into expectations and forcing the Federal Reserve to change soon its current very expansive monetary stance.
The debate about inflation was building before the latest data releases. It was especially heated in February and early March, when the $1.9 trillion stimulus package crafted by the Biden administration was up for legislative approval. If in 2020 the initial reaction of economists and commentators to the dramatic recession induced by the pandemic was unanimous, with almost everyone urging immediate measures both of relief and stimulus, the first Biden package stimulated criticism and misgivings in various quarters. Some economists, like Lawrence Summers and Olivier Blanchard, were especially vocal in pointing out the dangers associated with the stimulus package later approved by Congress, fearing that another major fiscal effort on top of those enacted in 2020, would be much more than what would be needed to close the recessionary gap, thus causing overheating and potentially stoking long-dormant inflation. Others, like Paul Krugman, have judged these fears to be excessive. Based on the general consensus on the very flat slope of the Phillips curve in recent decades, he has noted that even an overheated economy would be unlikely to produce serious inflation.
The latest numbers, far from entirely confirming the former view, reveal instead a rather nuanced situation. The increase of prices in April comes 12 months after the biggest drop due to the initial impact of the pandemic closures – which automatically produces high numbers. Moreover, it seems to be concentrated in particular items and sectors (used and rental cars, airfares, commodities such as copper and lumber) where a combination occurred, possibly of short duration, of bottlenecks in supply and a suddenly increasing demand. Various commentators suppose the surge in prices will fade away later during the year or next year, at most, when bottlenecks are removed and activity brought back to normal in all sectors. Also, labor shortages seem to be very selectively concentrated in particular sectors, especially leisure and hospitality. Josh Bivens and Heidi Shierholz of the Economic Policy Institute note that what seems a huge increase in the wages of the workers in the leisure and hospitality sector (about 18% at an annualized rate in the last three months) has in fact simply brought back those sectoral wages, enormously affected by the crisis, to their pre-Covid trend. With an overall unemployment rate as high as 6.1 percent, a labor shortage is far from being a generalized phenomenon.
Officials at the Federal Reserve do not seem to be much worried, at least for the time being. They expected some increase in the rate of inflation associated with the re-openings, and bet that it will be transitory. Expected inflation as implicit in long-term interest rates, though increasing in 2021, is still quite moderate.
Whether the US economy runs a serious risk of inflation will become clear in the next months. But one aspect of the debate is crucial, and it has to do with the supposed relationship between the size of the fiscal stimulus and the inflationary pressures. The main argument of those who predict a resurgence of inflation is that the big fiscal stimulus, even assuming cautiously small values for the various fiscal multipliers and even allowing for some savings on the part of the recipients of public transfers, could boost actual output several times well beyond the output gap – the distance between actual output and potential output. The latter is inferred from the estimates and projections produced by the Congressional Budget Office (CBO), particularly in its last release of February 2021.
Commenting on the April inflation data, Summers once again scores “the amount of money we are putting in the households’ hands relative to the capacity of the economy to produce,” invoking a need for tax increases to cool down an overheated economy. Based on IMF estimates, according to which the US economy is projected to run above potential in 2021, Martin Wolf believes the Fed should raise interest rates. Evidently, the question of how reliable output gap estimates are is crucial.
Actually, the question mixes several different questions. It’s not only a matter of the reliability of estimates – after all, as remarked by Claudia Sahm, the long history of frequent revisions of the estimates of potential output should invite much caution in using them as a basis for policy. More basically, there is the question of what the official institutions and mainstream economics define as potential output, how they measure in practice such an unobservable magnitude, and whether there is any stable relationship between the estimated output gaps and inflation. We addressed such basic questions in Fontanari et al. (2020) (preceded by an INET working paper in 2019), where we not only reviewed the fundamental flaws of the standard conception of potential output and the standard estimation methods but also proposed an alternative notion and measurement. In a new INET working paper, we now take up the issue both by proposing a refinement of our own method and reflecting on the appropriate measure of slack in the US economy.
The problems with the standard way of measuring output gaps
The standard notion defines potential output as the level of output compatible with stable inflation, thus corresponding to the ‘natural’ or non-accelerating-inflation rate of unemployment (NAIRU). Supposedly, standard estimation methods identify such natural rate empirically by observing the behavior of inflation. In practice, the unemployment-inflation relationship has revealed itself as particularly irregular over time, up to the point of the apparent and puzzling ‘disconnect’ observed in recent decades (see Del Negro et al 2020). This implies that inflation data play in practice a comparatively minor role in the procedures for empirical identification of the NAIRU (see the critical analysis on European economies in Brooks and Fortun, 2020). The main role is played by the theoretical idea that deviations of actual from equilibrium unemployment only occur on a temporary basis, so that standard estimation methods are based on the implicit assumption that the NAIRU must be the trend component of the time series of the actual rate of unemployment. Once this is fed into the elaborate models used for estimation of potential output, the latter ends up being measured in practice as very close to the trend of actual output. The procedure has obvious implications: if actual output is affected by a deep and long-lasting crisis followed by a slow recovery, as happened with the Great Recession, the estimated path of potential output is dragged down automatically and the measured output gaps, after the initial period of the recession, soon become of the order of few percentage points. There is nothing wrong in assuming that a protracted slowing down of actual output may seriously affect the long-term growth prospects – indeed, this is one of the main tenets of the demand-led growth approach. Over time, unused resources tend to dry up and progressively disappear – fixed capital is not replaced, firms close down, labor skills become obsolete in the unemployed. But these phenomena happen over long periods rather than in few quarters and happen precisely as a consequence of persistent underutilization. This means that big negative output gaps should be observable for protracted periods, a possibility that standard estimation methods rule out by construction.
Due to such excess sensitivity to the path of actual output, standard methods tend to underestimate systematically potential output and the output gaps, especially after a recession. The gross underestimation of output gaps for some European countries during the 2010s is something to which Blanchard himself has drawn attention in past works. But a further problematic feature of standard methods is that they produce output gaps that tend to be in fact poor predictors of inflation. The experience of the USA in the late 2010s may be instructive in this respect. According to the CBO’s estimates, the US economy has been in dangerous inflationary territory for years. Looking at real-time estimates, the unemployment gap (the difference between the actual rate of unemployment and the natural rate, a notion which is strictly linked to the output gap) has constantly been negative from 2017Q1 to 2020Q1, three full years. Yet, no uncontrolled acceleration in inflation happened in that period.
Instead, inflation has been oscillating around target, often below it. Figure 1 illustrates this. Even the multiple increases of the Federal Funds rate that the Federal Open Market Committee (FOMC) engineered from 2015 to 2018 were not justified on the basis of excessive actual inflation, but rather on estimates of inflation expectations and the presumption that very low unemployment rates would surely produce too much inflation later. Still more relevant, when the FOMC decided to lower the interest rates in July 2019, despite the estimated sign of the unemployment gap had been negative for 9 consecutive quarters, no appreciable burst of inflation took place. Inflation even declined in 2019Q3.
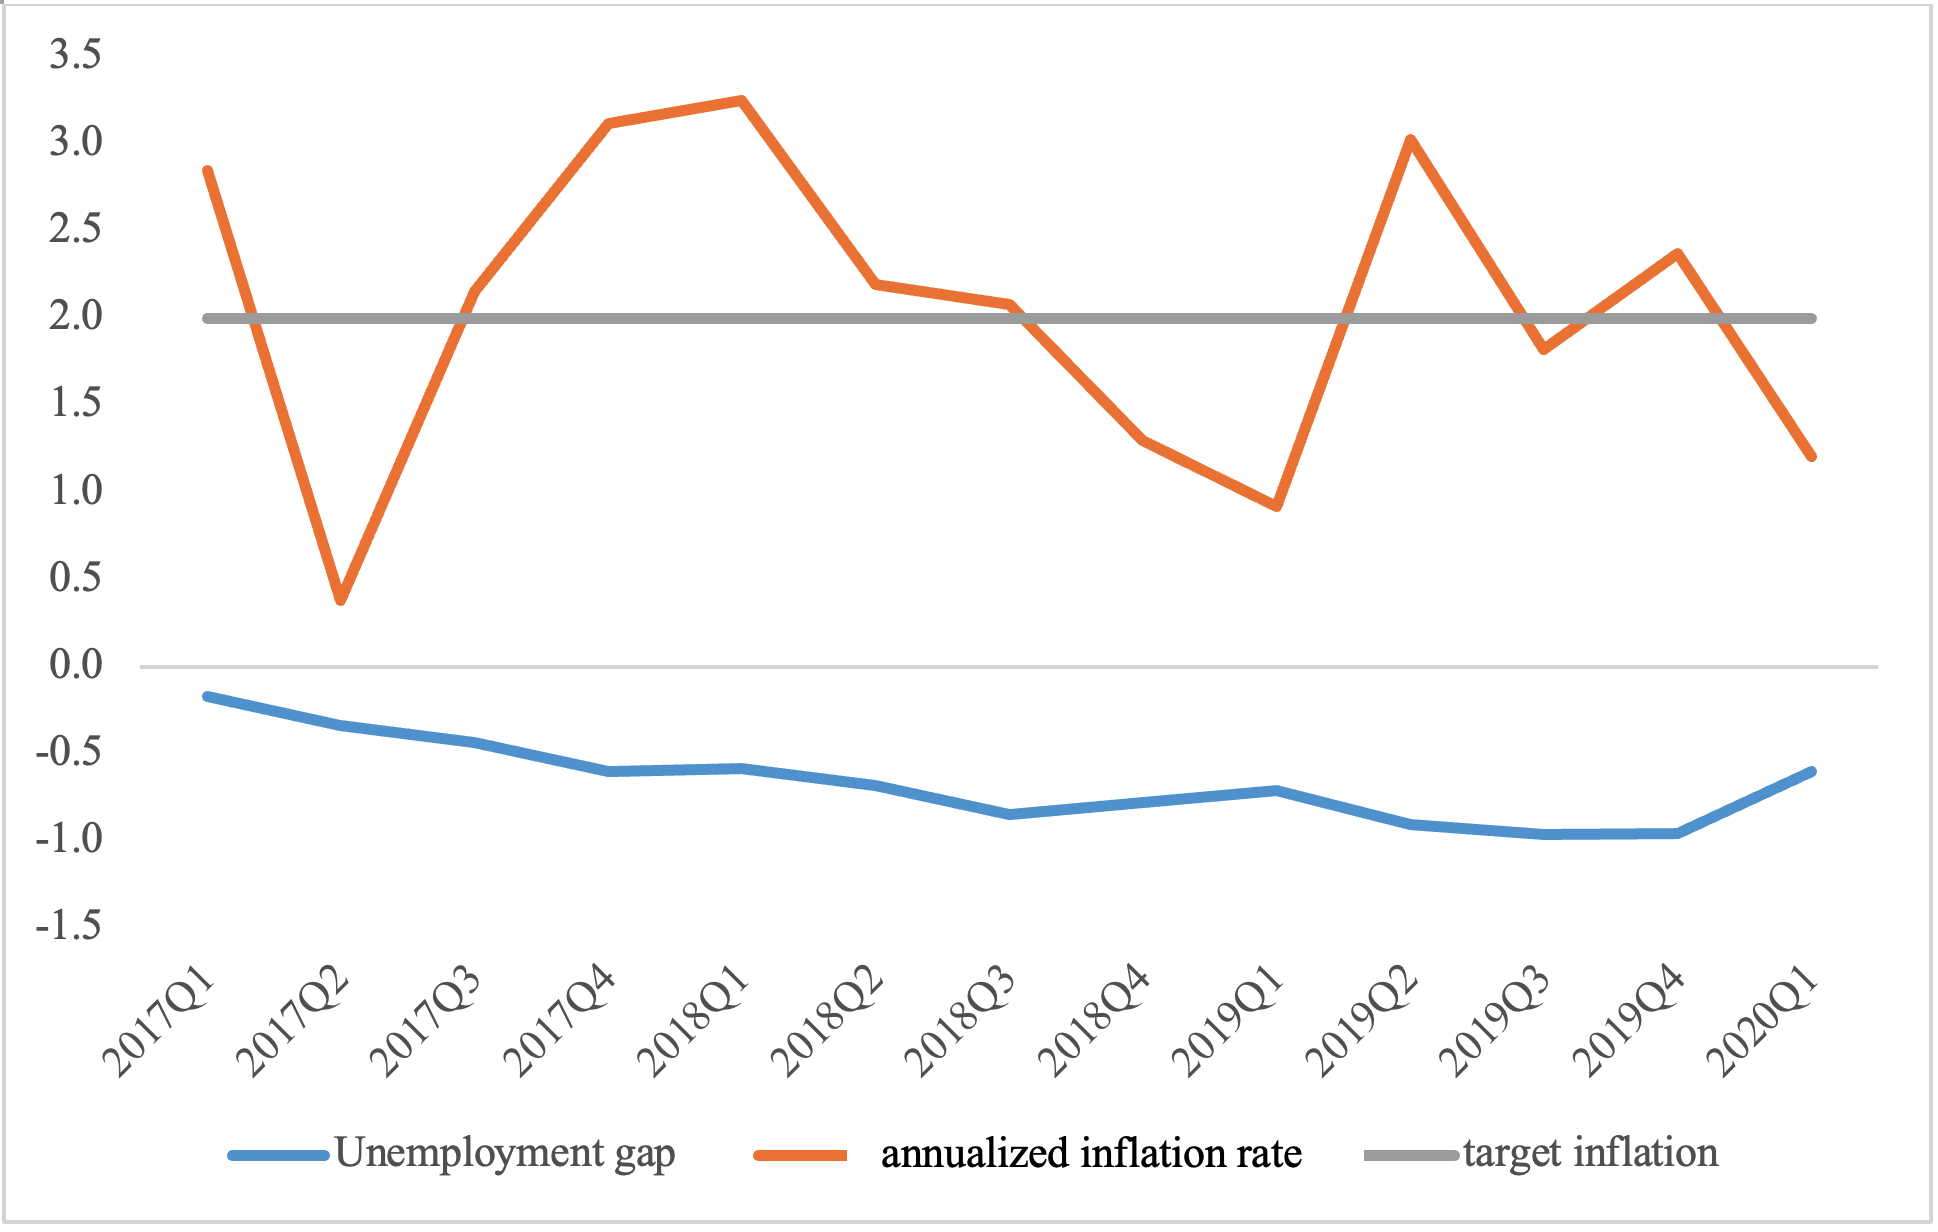
Figure 1. The unemployment gap and the annualized inflation rate in the USA – 2017Q1-2020Q1 Source: Our elaboration on CBO data
Clearly, it is not possible to base inflation fears on such flimsy measures because of their obvious failure to predict it or to be significantly correlated to it in the past. It is indeed ironic that measures of equilibrium unemployment and potential output entirely based on the definition of such magnitudes as the non-inflationary limit should prove in practice so utterly disconnected from the actual behavior of inflation.
Equally problematic is the uncertainty of the estimates of the output gaps and their variability across different agencies and institutions. Given that they employ different models to compute potential output – though all of them practically define it as some sort of trend component of actual output – and given the irregularity of the unemployment-inflation relationship in actual data, differences in model specification or in the value of particular parameters easily lead to different assessments of the output gaps. Uncertainty of estimates is well known since the same institutions producing estimates sometimes warn against putting too much weight on them (see for example Barkema et al. 2020).
To such traditional volatility and unreliability, the pandemic has added problems of its own, linked to the wild swings in economic activity and employment suffered by most economies and some practical difficulties in data collection. For its sudden and deep character, the pandemic recession has opened a wide output gap in 2020, but assessments of the size of the gap change quite remarkably across the different agencies.[1] Quite naturally, estimates also change as events unfold.
An alternative notion of potential output
It is not only a question of using estimates with more caution. The deeper problem lies with the notion itself, i.e. with the attempt at identifying a supposedly unique non-accelerating inflation rate of unemployment that in practice defies any quantification and the insistence in believing in a regular relation of some kind between unemployment and inflation that empirical evidence disproves. In our previous paper, we proposed to discard entirely the mainstream notion of potential output and turn back to the notion and measurement proposed by A.M. Okun in the 1960s, who defined and estimated potential output as an empirical approximation to a traditional Keynesian notion of full-employment output, understood as a sort of ‘maximum’ of production attainable in any given situation.
In updating Okun’s method and applying it to US data of the 1959-2018 period, we have shown that our measure is both immune to the flaws of the standard notion of potential output and consistent with the disconnect between inflation and unemployment so clearly borne out by empirical evidence in the last decades. Indeed, it entirely refrains from the use of inflation data, which implies that the deeply problematic Phillips relationship plays no role in it. It also avoids defining potential output as the trend component of actual output, allowing instead the opening up of sizeable, non-self-correcting divergences, in phases of slack, between actual and potential output. This reflects our theoretical idea, typical of the demand-side perspective, that no automatic mechanisms ensure the tendency of actual output towards potential.
What we propose, in other words, is to separate the analysis of inflation from the analysis of the level of unemployment, and to use the notion and measure of potential output to assess the distance of the economy from the full employment goal. The experience (but also the economic literature) of the last decades clearly shows the failure of models based on a strict link between activity level and inflation and the relevance of cost-push factors in determining inflation. This does not amount to renouncing the fight against inflation (if and when the April surge in prices becomes a true inflation process in the following months), but to renouncing the hypothesis that such a fight necessarily implies increasing unemployment and reducing the level of activity.
What is full employment?
The measure of full employment is necessarily conventional, since allowance must be made for some amount of irreducible unemployment that inevitably characterizes even a very healthy labor market. Based on this, in our 2020 paper, we proposed to consider different values of the rate of unemployment as possible targets and showed that in all cases the output gaps computed with our Updated Okun Method tend more often to be negative and are bigger in size than those obtained by the CBO.
Yet, both the experience of the late 2010s and, more recently, the turmoil that the pandemic has caused in the labor market have shown clearly that the (official) rate of unemployment may be a highly imperfect indicator of labor underutilization. The very low unemployment rates of the late 2010s went together, in the USA, not only with a sluggish growth of wages but also with comparatively low participation rates, even in the 25-54 age range. In other countries like Germany low unemployment was accompanied by a reduction of individual working time for various categories of workers. If doubts could already be cast on the reliability of the unemployment rate as an indicator of labor underutilization in the long recovery of the 2010s, the dramatic events associated with the pandemic have only reinforced these doubts. The contrasting cross-national policy responses to the crisis, which in most European countries have taken the form of short-time work schemes, have meant that the (possibly analogous) strong reduction in the labor input in 2020 has had enormously different effects on the unemployment rates in Europe and the USA. Moreover, the pandemic has brought remarkable changes in participation rates and working time, implying a rather more substantial amount of slack, in most economies, than that recorded by the official unemployment rates.
Our new paper addresses such questions. In it we review possible alternative indicators of labor underutilization, starting from the ‘broad’ indicators of unemployment computed by the Bureau of Labor Statistics (BLS), which take into account such phenomena as discouragement in participation and part-time employment for lack of full-time opportunities. We test Okun’s law – originally a regular empirical relationship between output growth and changes in unemployment – with some of these ‘broad’ unemployment indicators (both for the United States and for a panel of OECD countries) and find confirmation of the general validity of the law, both across countries and with different indicators of unemployment
But these broad indicators, although likely to be better indicators of actual unemployment than the official rate, may fail to properly account for the full degree of slackness in the labor market. After all, such indicators hit historically minimum values in 2019, along with the official unemployment rate, while data on labor force participation and the subdued growth of wages pointed to the existence of margins for further expansion of labor utilization.
We thus explore, in the paper, other indicators of labor underutilization that take into account working time, so as to capture that kind of underutilization that derives from people working fewer hours than they would be prepared to work. The literature review brings us to propose a new indicator of the labor input based on hours worked, which we regard as a more accurate expression of the actual extent of labor utilization. This indicator, which we obtain by dividing the total number of hours worked in the economy by the working-age population,[2] we label ‘standardized hours worked.’ On testing Okun’s law with such an indicator, we find again confirmation of the validity of the law, both on a panel of OECD countries and on US data.
Output gaps
In the final part of our paper, we offer estimates of the US output gaps. We focus on the last part of the 2010s and on a tentative assessment of the gaps opened up by the pandemic crisis in 2020. As a rule, we believe that all estimates of the output gaps – even our own – should be used with caution, due to the inevitable approximations and simplifying hypotheses that are implicit in the procedure (in any procedure). Especially real-time estimates may prove less than entirely reliable.
However, our calculations offer in our view some interesting insights. Our Updated Okun Method requires setting an appropriate target value for each indicator of labor utilization/underutilization, supposedly identifying a situation of full (or almost full) use of the labor input, against which potential output is estimated. Thus, in the first place, our calculations allow focusing on the comparative merits of the various indicators and their ability to correctly measure the quantitative dimension of labor underutilization. Due to the conventional nature of the full-employment measure, we may set different target values for each indicator, which implies that the measure of the output gaps varies according to both the indicator and the value chosen as a desirable policy target. This we regard as a positive feature of our method since it transparently links the extent of the gap to the policy objective and invites proper policy use of the gap notion.
In the second place, notwithstanding such possible multiple estimates, our method gives across all indicators uniformly wider output gaps than those calculated by the CBO or the IMF, thus revealing once more the strong tendency of standard methods to systematically underestimate the margins for output expansion. Particularly wide is the gap revealed by our indicator of standardized hours worked, pointing to the relevance of the time-related dimension of labor underutilization both in the long recovery of the 2010s and in the pandemic crisis of 2020.
The latest data on the labor market in the USA show a slowing down in the pace of recovery, with a slight increase in the unemployment rate and 8 million jobs still missing with respect to the pre-pandemic period. Not only does the unemployment rate still linger at 6%, well above the pre-pandemic level, but data on participation (particularly on women’s participation, doubly hit by low wages and lack of affordable child care) reveal how such figures grossly underestimate potential labor reserves. Current inflationary pressures are likely a temporary phenomenon, linked to the peculiarity of the pandemic crisis and the bottlenecks it has produced. Even if they are not, it is not an excessively tight labor market or a too rapid filling (or even overshooting) of the output gap that is to blame. If anything, the pandemic has reinforced the disconnect between unemployment and inflation already well established in the literature. The more relevant risk remains that of taking too seriously the official measures of the output gap, thus neglecting both the actual extent of slack that they are not able to reveal and subtracting vital stimulus and much-needed relief from a still suffering labor market. This would cause slow growth and stagnating demand, which, as past history has shown more than once, do not only produce underutilization and distress in the short period but also create long-term damage to growth.
References
Barkema, J., Gudmundsson, T., Mrkaic, M. (2020). What Do We Talk About When We Talk About Output Gaps? International Monetary Fund Working Paper, No. 2020/259.
Brooks, R., Fortun, J. (2020). Eurozone Output Gaps and the COVID-19 Shock. Intereconomics, 5, 291-296.
Del Negro, M., Lenza, M., Primiceri, G. E., Tambalotti, A. (2020). What’s up with the Phillips Curve? National Bureau of Economic Research, No. 27003.
Fontanari, C., Palumbo, A., & Salvatori, C. (2020). Potential Output in Theory and Practice: A Revision and Update of Okun’s Original Method. Structural Change and Economic Dynamics, 54, 247-266. https://doi.org/10.1016/j.stru…
Okun, A. (1962). Potential GNP: Its measurement and significance. In: Proceedings of the American Statistical Association, Business and Economic Statistics Section, Washington. ASA, pp. 98–104.
Notes
[1] For example, the International Monetary Fund (IMF), in its World Economic Outlook of October 2020, calculated that the output gap in 2020 would be -3.2% for the USA (the figure is confirmed in the IMF’s WEO of April 2021), while according to the Economic Outlook of the Organization for Economic Co-operation and Development (OECD) of December 2020, it would amount to -6.0%. A still wider discrepancy regards the UK output gap, estimated at -4.4% for the IMF and -8.9 for the OECD.
[2] The ‘standardization’ ensures that the indicator is not influenced by the changing size of the economy. We actually build two different indicators, since the working-age population may be defined, alternatively, either as the population between the ages of 16-64 or as the whole population of 16 years or more. See the paper for details.