Why it’s time to repeal the debt ceiling and replace it with a ‘truth in borrowing’ act
Debt policy in the United States is a tangle of distortions, omissions, and policy blunders made worse by the distracting bright light of the statutory debt ceiling. The debt ceiling anchors policymaker thinking and distracts from other forms of government debt that are growing steadily and now total more than $11 trillion. The Constitution requires Congress to approve all borrowing done in the name of the United States.
To meet its constitutional responsibilities, Congress should repeal the statutory debt ceiling and replace it with a “Truth in Borrowing Act” that puts all government debt on the table and addresses tendencies in human thinking that bias decision-making.
Debt matters. In Between Debt and the Devil, Adair Turner points to dependence on rising debt levels to support growth as the primary cause of the Great Recession, arguing that this dependence is the central challenge to our future. [1] Debt policy is fiscal policy. The true levels and composition of debt for which taxpayers are responsible matter to fiscal policy implementation. The United States calibrates monetary policy very precisely. Federal Reserve rates and asset buying are accounted for to two decimal points. U.S. fiscal policy is a cloud of uncertainty. Rather than document and include the hard-to-estimate debt, policymakers choose to fly blind and allow non-Treasury debt to grow in unmanageable and potentially destabilizing ways. The choice is not accidental. It is the result of well-known decision-making biases and the preferences of policy participants.
Unaccounted-for debt includes, among other things, deferred infrastructure maintenance, government pension plan insufficiencies, and environmental costs for which no reserves are being set aside. The growth of these debts amounts to hidden deficit spending. The money not spent to maintain a vital bridge is being spent elsewhere. Until all the spending and debt is on the table, it will be impossible for policymakers to know whether the most important priorities are being met.
Information Asymmetry and Moral Intuitions
Until mid-2007, investors around the world bought triple-A-rated mortgage-backed securities (MBS) thinking these were top-quality Porterhouse steaks. When rumors started in mid-2007 about bad quality, they looked inside their MBS packages and found subprime sausages. The result sent worldwide mortgage markets into the kind of downward spiral that George Akerlof identified almost 50 years earlier in “The Market for Lemons: Quality Uncertainty and the Market Mechanism.” [2] MBS buyers withdrew from the mortgage debt market. Sellers of high-quality mortgages could not get fair prices and stopped making new mortgages altogether. The sellers of subprime debt went bankrupt. Millions of people lost jobs, homes, and futures. Only central bank buying of MBS and Treasury debt kept the world economy from a major depression.
A few years after Akerlof described information asymmetries, cognitive scientists Daniel Kahneman and Amos Tversky published research that explained another way markets can become unstable. They described three cognitive shortcuts that enable fast decisions but “lead to systematic and predictable errors.” [3] From those original insights on “bounded rationality,” a river of research in behavioral economics flowed, culminating in widely read books such as Kahneman’s Thinking Fast and Thinking Slow and Richard Thaler and Cass Sunstein’s Nudge. More recently, Jonathan Haidt’s The Righteous Mind brings together research that shows that even carefully reasoned right decisions are often the victim of elaborate rationalizations of what is personally best for the decision-maker.
If the lessons from the lemons-asymmetry problem and distortions caused by cognitive heuristics had been at the forefront of economist, lawmaker and regulator thinking, it is likely the Great Recession could have been avoided. In the years before, did they simply forget some of the most path-breaking research in economics? Not at all. Information asymmetry and cognitive biases were discussed continuously by academics and even emerged in policy discussions at the Federal Reserve’s famous Jackson Hole policy symposiums in the late 1990s and early 2000s.
What happened? The answer is an unlit area of policy that escapes the attention of most economists. In the way described by Haidt, the collective judgments of financial institution executives expressed their innate acquisitiveness and felt morally right. Acting on their “moral intuitions,” these executives and the institutions they supported published widely read rationalizations about the benefits of freer markets. Prompted by the drumbeat of rationalizations, small, arcane, and often unnoticed changes were made to “free up” markets. One example entailed letting subprime debt issuers pay for their credit ratings. This led to competition among rating agencies to attract clients by offering high ratings. The result was sausages being rated as top-quality steak. Another change involved exempting over-the-counter (OTC) derivatives from regulation by the Commodities Futures Trading Commission. This enabled speculation in mortgage-related credit default swaps to grow uncontrollably.
The speculation had no connection to the underlying assets or real business risks. It was simply a form of gambling, which under state gaming laws was illegal – that is until a single provision was inserted into the 2000 Commodity Futures Modernization Act exempting OTC derivatives from regulation. At the peak of the mania, OTC derivatives totaled $604.6 trillion, more than ten times world gross domestic product (GDP). The OTC bubble collapsed in 2008 and caused six of the ten largest bankruptcies in U.S. history – Lehman Brothers, Washington Mutual, General Motors, CIT Group, Chrysler, and Thornburg – with assets totaling of $12.1 trillion.
U.S. Debt Ceiling and Constitution
In 1787, when the Constitution was being drafted, Thomas Jefferson warned fellow Founding Fathers James Madison and Alexander Hamilton about the likelihood that living Americans might hurt future ones by running up debts so large they would put undue burdens on succeeding generations and necessitate taxes that are unjust because they violate one of the most important principles fought for in the Revolutionary War: the principle of no taxation without representation.
Jefferson urged including a provision in the Constitution that would prevent living generations from passing debts on to future generations. Hamilton and Madison resisted. Hamilton argued that if the government’s debt is not “excessive” it won’t diminish future liberty but may enhance it by strengthening the development of the financial sector and the central government. He stressed that the “creation of debt should always be accompanied with a provision for its extinguishment.”[4] The debt burden final agreement is in Section 8 of Article I of the Constitution. It says only Congress can authorize borrowing money in the name of the United States. From the Constitution’s ratification in 1788 until 1917, Congress authorized every single issuance of U.S. government debt. To provide more flexibility in financing World War I, Congress moved from approving individual issuances to setting a debt ceiling in 1917.
In the 100 years since it was enacted, the debt ceiling has been revised upward 105 times. As fiscal room to maneuver diminished in recent decades, ceiling increases were needed more frequently and became intensely contentious. Warnings about burdening future generations were frequently expressed. Sometimes political compromises were so difficult that government shutdowns were needed until agreements could be reached.
Debt Ceiling Suspensions
Since 2015, debt ceiling increases have taken the form of ceiling suspensions that allow the government to borrow as much as it needs. On the last day of a suspension, a new ceiling is set that includes the amounts borrowed during the suspension. In November 2015, for example, compromise was reached between Congress and the Obama administration by agreeing to suspend the debt ceiling until March 16, 2017. On that date, the ceiling was increased to include all debt issued since the 2015 agreement. By using ceiling suspensions, Congress permits the government to increase its borrowing without a limit. Repeated suspensions effectively eliminate the debt ceiling.
Romina Boccia, chief fiscal policy expert at the Heritage Foundation, a conservative think tank, is a leading critic of ceiling suspensions. In her comments you can hear Jefferson’s concern. “In many ways,” she said, “a debt-limit suspension is like giving the Treasury a credit card with no limit, or a blank check to be cashed against younger and future generations….”[5]
However, Boccia is concerned only about Treasury debt. If the United States were a company, we would call this “on-balance-sheet” debt. It is the debt prominently recorded in the company’s financial statements. There may also be “off-balance-sheet” debt tucked away in footnotes. This debt might include anticipated lawsuit settlement payments, engineering cost estimates for building maintenance that exceed reserves the company has set aside, or consultant estimates of insufficient property and casualty insurance.
On-Balance-Sheet Debt Forecasting Accuracy
The Congressional Budget Office (CBO) is responsible for analyzing the economic and budget effects of legislative actions, including forecasting debt levels. However, Congress limits the CBO in its budget forecasts to consider only debt that is the result of enacted federal statutes. The definition of debt covered by the debt ceiling is the total amount of on-balance-sheet federal debt of the United States. That now stands at about $20 trillion. The definition of debt thought by most experts to be economically appropriate and the focus of CBO’s debt level forecasts is Treasury debt in the hands of the public. This now totals $14.7 trillion or about 77 percent of GDP.[8]
The CBO regularly publishes updates on the accuracy of its forecasts. The chart below is from the CBO’s most recent accuracy assessment. three groups, however, are on the high side – that is, all three have been consistently too optimistic.
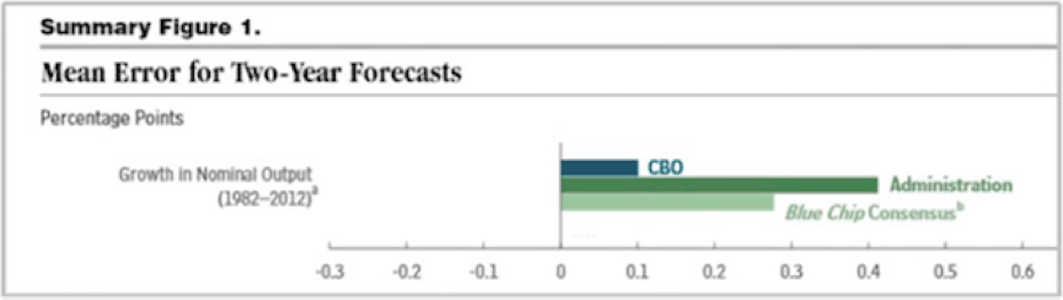
Over the past 20 years, the CBO has published 175 projections of future debt levels. Antony Davies, an associate professor at Duquesne University, reviewed all the projections and found:
“For the past 20 years on average, the actual federal debt has been 20 percent larger than what the CBO had predicted five years earlier, and 250 percent larger than what it had predicted 10 years earlier. This means that when the CBO tells us, as it did last [June 2017], that the government’s debt will top $30 trillion 10 years from now, the real number is likely 2.5 times that, or $75 trillion.”[10]
Off-Balance-Sheet Debt
Infrastructure Debt
When repairs to a road, railway, or bridge are delayed, the cost of the repairs becomes a debt that grows year by year until the repairs are finally made. The $5.2 trillion maintenance liability is a life and death matter. The collapse of the I-75 overpass in Cincinnati killed one man and the I-35 West Mississippi River Bridge collapse killed 13. The near failure of the Oroville Dam in Northern California forced the evacuation of 200,000 people, and tens of thousands of children and adults in Flint, Michigan, may have been poisoned by lead in the drinking water from its unmaintained water system.
Some argue that infrastructure needs are state and local government responsibilities. This misses the point and reveals the way a crimped perspective on debt distorts careful thinking. Whether it is a state or federal burden is immaterial. Spending that is the result of legislative action or inaction and the responsibility of taxpayers is fiscal policy. If the fiscal policy involves spending that exceeds revenues, the result is deficits and increases in accumulated debt.
When a government is not spending to maintain its infrastructure, it is certainly spending its revenues on something else. Perhaps it is providing subsidies to a new professional sports stadium. If the long-term revenue benefits of the new stadium equal the long-term costs of not maintaining regional infrastructure, then off-balance-sheet liabilities will be constant. Spending on stadium subsidies may have a higher return than spending on infrastructure. This is a question that needs to be rigorously answered by governments across the nation in order to know whether the aggregate fiscal policy stance of the United States is expansionary or contractionary.
If Congress wants to know the true U.S. debt position, it needs to direct the CBO to gather and aggregate the on- and off-balance-sheet borrowing of regional and state governments, as well as the federal government. With this information the comparative returns on different kinds of spending will be clearer. Is it better to spend on stadium subsidies or prekindergarten? Sports infrastructure or human capital? Until the information is acquired and analyzed, there is no way to know.
Pension Debt
State and local government pension shortfalls are another form of off-balance-sheet debt. According to the Center for Retirement Research, pensions were generally fully funded in 2000.[11] By 2015 they were underfunded by $1.38 trillion.[12] Roughly 20 percent of pension plans are now more than 40 percent underfunded. Another 44 percent of plans are about 30 percent underfunded.[13] Some plan shortfalls are so large they will almost certainly need federal assistance.
Optimism bias is still at work here. The $1.38 trillion shortfall assumes the pensions will achieve an average annual rate of return of 7.6 percent indefinitely. This same bias was at play in the 2008 financial crisis. Home loans were made without regard to the borrowers’ ability to pay, and these loans were sold to investors based on financial models that assumed losses could be diversified and structured away. The underpinning to this thinking was that home price growth had been high for decades, much like equity returns are now. It occurred to almost no one this could significantly change.[14]
Rather than rely on an assumed rate, each pension plan should use a rate that reflects the plan’s risks. This is the approach recommended by the Pension Task Force established by the Actuarial Standards Board.[15] Following this approach, Joshua D. Rauh at the Hoover Institution, a leading conservative think tank, estimates that the 2015 nationwide off-the-books pension shortfall was $3.85 trillion. This means state and local government pensions are only 48.3 percent funded on average and only one state – Delaware – has a pension plan that is more than 70 percent funded.[16]
Environmental Debt
Climate trends are creating off-balance sheet liabilities that need to be included in congressional accounting. McKinsey, the global management consulting firm, in a 2013 report estimated the total present-value investment worldwide that would be needed over a 20 year period to prevent the rise in global temperatures exceeding 2°C[17] – the target set in the Paris Climate Accords. Most climate scientists believe that keeping global warming pegged to that limit will prevent the worst-case outcomes.[18] The U.S. share of this cost would be about $2.3 trillion.[19]
One very important climate effect is sea level rise. Like CBO debt forecasts, official sea-level forecasts have been consistently too optimistic. Accuracy is critically important. Almost 40 percent of Americans live in shoreline counties adjacent to an open ocean, major river, or the Great Lakes.[20] The evidence of sea level rise is clear and conditions are worsening. What is less clear is scale of the tendency to ignore or underestimate bad news. Estimates of the amount of sea level rise, for example, keep coming in at the top of previous estimates. The gray area in the chart below is the range of official sea-level increases estimated in 2007.
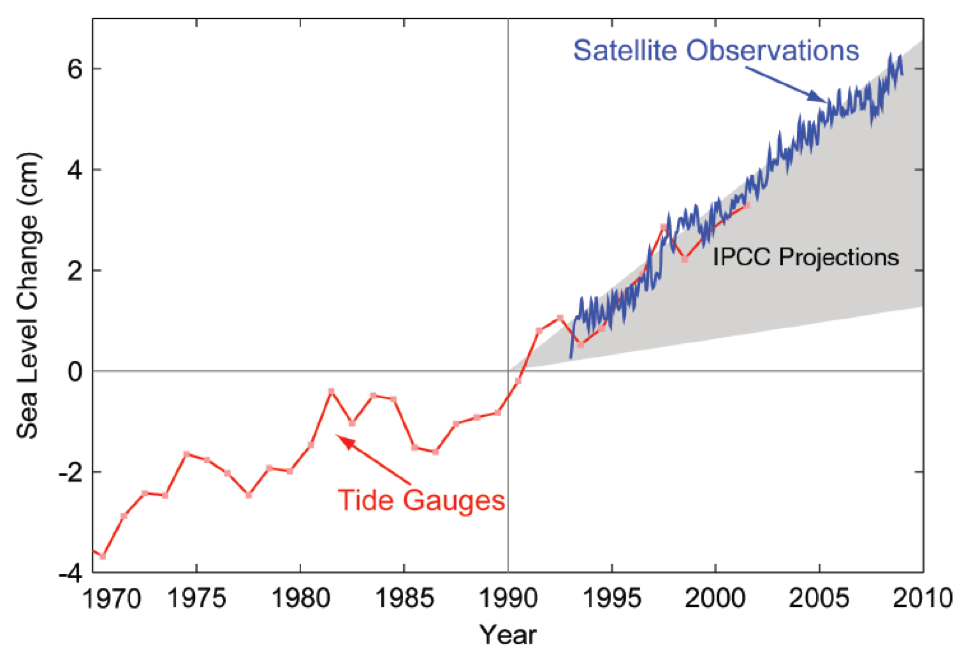
Underestimates by experts are not surprising. Of the kinds of biases that can affect judgments, scientific experts are particularly prone to “loss aversion.” For them, it is too often better to be part of the consensus than to be accurate. Making a forecast more dire than the consensus risks losses in reputation and funding. As a consequence, expert forecasts of sea level rise are consistently too small. As it turns out, the climate model simulations underestimated the rate of sea level rise because the speed of ice sheet and glacier melting was not incorporated in the models. Why? Consistent with academic loss aversion, the data were not included because they were not considered “sufficiently robust.”[22]
The McKinsey estimate is what is needed to prevent worst-case outcomes. Are there costs associated with less-than-worst outcomes? Are there costs associated with non-catastrophic sea level rise, superstorms, or megadroughts? If so, what is the total of those costs? Some estimate is needed no matter how tenuous. Leaving it out because it is hard to estimate guarantees that the sum of worse-case and non-worse-case outcomes will be an underestimate.
Total Off-Balance-Sheet and On-Balance-Sheet Debt
The infrastructure, pension, and environmental debt considered here are just three categories of off-balance-sheet debt that are easily identified and widely acknowledged. They total $11.3 trillion, or 59 percent of GDP. The on-balance-sheet Treasury debt in the hands of the public totals $14.7 trillion or about 77 percent of GDP.[23] Together the on-balance-sheet and off-balance-sheet debt total 136 percent of GDP.
Human Thinking and Decision Errors
In Thinking Fast and Slow, Kahneman explained that our minds can be thought of as having two parts, an older part that developed over millions of years and a newer part that developed as we became verbal, socially complex and human. The older part thinks fast. It is about survival and propagation. The modern part thinks slowly. Fast thinking is automatic, frequent, emotional, stereotypic, and subconscious. It is quick, intuitive, and wordless.[24] It enabled us to respond instantly to predator and enemy attacks. The newer part that makes us distinctively human thinks slowly. It is infrequent, logical, calculating, and conscious, hard to maintain, and tiring. It is the kind of thinking you are doing now as you read and think about economics, moral choices and the debt ceiling.
Going a step beyond Kahneman, Haidt in The Righteous Mind argues that our initial sense of what is right and wrong – our morality – is the result of what he calls “intuitions” emerging from within the older fast thinking part of our mind.[25] They are not the result of step-by-step logical analysis or of innate capacities like the ability of birds to make nests without being taught. They are intuitive interpretations of situations and decisions about what to do that emerge and occupy our mind before we rationally and slowly weigh the pros and cons of a situation. For Haidt, “Intuitions come first, strategic reasoning second.”
Haidt argues that the fast part of our brain is much more influential and cognitively larger than the newer slow part. The fast part had to find food, deal with predators, and tell friend from foe quickly in a vast natural environment. This fast part supports our eyes, ears and all the muscles and organs of our body. It has to be physically large in order to process massive amounts of information. Thirty percent of our brain, for example, is devoted to visual processing alone.
To give a sense of the relationship between the fast and slow minds, Haidt uses the metaphor of a rider on an elephant. The elephant is our primitive brain. It is large, fast thinking and intuitive. The intuitions, or moral judgments, emanating from the elephant express our genetic predispositions, subconscious wants, and accumulated life experience. The rider is small, slow thinking and rational. The rider is always carried where the elephant wants to go and is constantly providing after-the-fact explanations and rationalizations for the elephant’s moral decisions. The rider is like a press agent.
If the elephant wants to lean right, the press agent explains why moving right is the correct thing to do. We all know this tendency. We are on a diet, but there is ice cream on the menu. For millions of years sugar was scarce. Our “elephant” wants the ice cream. Instantly, “one scoop won’t matter” rationalizations bubble up in our mind – that’s our press agent.
The elephant is the source of many of the biases that confound us. Naturally, when we want ice cream, we prefer to be around people who also like ice cream. Being part of the herd or tribe increases survival odds. It should be no surprise that we consistently seek out people who agree with us and prefer information that confirms our elephant intuitions. This is known as confirmation bias.
We prefer the part of the forest or the savanna we know, and we prefer to do things the way they have been successfully done in the past. This is called status quo bias. Our preference for the status quo keeps us from taking risks and moving into new parts of the forest, or making changes and taking a different path to the water hole, unless the payoff is clearly positive.
In the real world, if one elephant wants the soft inner bark of a tree, it is not an environmental problem. If a herd of elephants wants the inner bark, they can destroy a forest on which they all depend. When we have a taste for fish, our press agent will explain why a seafood diet is good for us and morally right. When millions of us want seafood, millions of press agents will spew reasons why this is the right thing to do. The press agents will do this even though, to meet our wants, we deplete fisheries worldwide.
Moral Intuitions and Unaccounted for Borrowing
Haidt’s moral intuition theory provides a way to understand Congress’ awareness of off-balance-sheet debt and its inaction with respect to it. The key for economists to understand is the difference between the policy platforms of political parties that are the result of slow-thinking consensus, and the policy actions of politicians that are the result of fast-thinking self-interest. The platforms of both the Republican and Democratic parties contain aspirational language about fiscal responsibility. However, these aspirations do not reflect the moral preferences of elected party members.
Numerous congressional hearings have been held on the growing costs of delayed infrastructure maintenance, worsening pension underfunding, and rising environmental costs. Congress is fully aware of the debts but chooses to take no action to require the CBO to account for them. The inaction by Democrats and Republicans alike reflects the political herd’s unspoken preference, tilted by status-quo, confirmation, and other biases, to focus only on Treasury debt and continue to enjoy the soft inner bark of unaccounted-for borrowing.
The herd’s inaction is affirmed by the people and institutions around it. None of the special-interest corporate and entitlement-spending advocates and none of the well-known think tanks that research and develop national policy appear to want Congress to include off-balance-sheet debt in CBO accounting. The reason is clear: the present composition of state and federal spending benefits tens of thousands of companies and tens of millions of people. These people and companies are the members and funders of special-interest and think-tank institutions. Including off-balance-sheet debt in official calculations would almost certainly threaten flows of payments to them. As a consequence, the collective intuition of all these decision participants is that ignoring off-balance-sheet debt in official accounting is morally acceptable. Once deemed so, the self-interest of the participants assures the debt will remain unaccounted for.[26]
A second conclusion that can be drawn from seeing congressional decision making this way is that it will not change until a debt crisis makes it unmistakably clear, as the Great Recession did with respect to banking and mortgage lending, that Congress needs to put unaccounted-for debt on the nation’s balance sheet.
Choosing and Matching Options
Usually, policy is arrived at by identifying options for dealing with a problem, separating options from each other, and then selecting the one that maximizes the decision-maker’s highest priority. In this case, Congress chooses not to include off-balance-sheet debt because this choice maximizes its preference to continue to do as it has in the past. This is the “choice” approach to decision-making.
An alternative approach is to match the options, asking at what point do the options equal each other. Matching changes the way responses to problems are viewed. Instead of A or B, it sees B as what you give up in order to have A and vice-versa.
For debt policymakers, “choice” involves including off-balance-sheet government debts in official forecasts or continuing to leave them out. “Matching” involves asking at what point does leaving them out cost as much as putting them in. Matching asks what amount of the risks associated with not accounting for known obligations are you willing to take on in order to keep the comforts and ambiguities of current policy?
What risks should Congress be worried about? One risk is economic growth. Using data on a sample of 40 advanced and developing countries for 1965 through 2010, a group of researchers from the Federal Reserve, Cambridge University, University of Southern California, and the International Monetary Fund found, “significant negative long-run effects of public debt build-up on output growth.”[27]
Another risk is a sharp economic downturn triggered by a stock-market selloff. Have there been any U.S. debt-related growth threats? Yes, in 2011. In midsummer 2011, the Republican Party demanded that President Obama commit to reducing the deficit in exchange for increasing the debt ceiling. The flare-up in political tension triggered a shift in investment manager beliefs from thinking that spending cuts and tax increases would be needed in the distant future to thinking that they would be needed within two to three years. For them, lower near-term spending and higher taxes meant lower corporate profits, reduced household spending, lower stock values and a weaker economy. The weaker economy meant lower inflation and lower Federal Reserve interest rates. Thinking this, investment managers sold stocks and bought safe Treasury bonds. At the height of fiscal anxieties from mid-July to mid-September, the S&P stock index fell 15 percent and long-term Treasury bond prices rose more than 25 percent.
High debt-to-GDP levels and off-balance-sheet debt have instability costs that Congress needs to consider. The 2011 crisis was the result of a sudden change in investor expectations about when fiscal adjustments would need to take place. In the past two decades, undisclosed debt was the main cause of the two largest non-Great Recession corporate bankruptcies, WorldCom and Enron. Accounting fraud engaged in to hide the true condition of the companies sent several top executives to prison.
Congress is consistently choosing to ignore off-balance-sheet debt. State governments are doing the same when they do not fund infrastructure maintenance and pension shortfalls, reserve against environmental costs, and allow other kinds of implicit debt to accumulate. The result is inevitably higher debt burdens on the economy and taxpayers. Most importantly, ignoring off-balance-sheet debt prevents governments from knowing how to best allocate scarce capital. This no doubt contributes to the country’s comparative weakness in global health and education attainments.
U.S. life expectancy, for example, is one of the lowest in the developed world at 78.9 years[28] and the infant mortality rate is 5.8 out 1000 live births – almost double that of most developed countries and analogous to developing countries like Chile and Russia.[29] The U.S. ranks 24 out of 34 OECD nations in math and science education.[30] The combination of our poor health and education systems is the reason 71 percent of young Americans cannot qualify for the military services.[31] Relative to other developed countries, the United States appears to be under-investing in human capital.
In making debt policy, Congress needs to shift from a choice approach to a matching strategy. It needs to recognize that the price the nation pays to ignore off-balance-sheet debt is the risk of debt instability. Several past instances indicate the price is high.
Truth in Borrowing Act
Congress should respect the responsibility placed on it by the Constitution for all borrowing in the name of the United States and acknowledge unaccounted-for debt that is accumulating as a result of state and federal inaction. To meet its constitutional obligations, Congress should repeal the failed debt-ceiling approach, especially the ceiling-suspension technique, and replace it with a ‘Truth in Borrowing Act’ that requires the CBO to gather information on all material on- and off-balance-sheet debts. This step will enable Congress to match its policy options and regain control of fiscal policy by accounting for all the accumulating debt for which tax payers are responsible.
* Mr. Blitz is an investment management consultant. Mr. Dugger is a retired hedge fund partner and Institute board member.
Footnotes
[1] Turner, Adair. Between Debt and the Devil: Money, Credit, and Fixing Global Finance. Princeton University Press. 2015.
[2] Akerlof, George A. (1970). “The Market for ‘Lemons’: Quality Uncertainty and the Market Mechanism”. Quarterly Journal of Economics. The MIT Press. 84: 488–500.
[3] Tversky A, Kahneman D. “Judgment under Uncertainty: Heuristics and Biases.” Science. 1974 Sep 27;185(4157):1124-31. https://www.ncbi.nlm.nih.gov/p…
[4] Alexander Hamilton, “The Defence of the Funding System,” Founders Online, National Archives, last modified June 29, 2017, [Original source: The Papers of Alexander Hamilton, vol. 19, July 1795 – December 1795, ed. Harold C. Syrett. New York: Columbia University Press, 1973, pp. 1–73.] https://founders.archives.gov/…
[5] Romina Boccia “2017 Debt Limit Should Trigger Spending Limit—with Enforcement” http://www.heritage.org/debt/r…
[6] American Society of Civil Engineers. Failure to Act: Closing the Infrastructure Investment Gap for America’s Economic Future. Arlington, VA: American Society of Civil Engineers, 2016. Retrieved from ttp://www.infrastructurereportcard.org/wp-content/uploads/2016/10/ASCE-Failure-to-Act-2016-FINAL.pdf.
[7] Peter Olson and David Wessel, “The case for spending more on infrastructure maintenance” Tuesday, January 31, 2017 https://www.brookings.edu/blog…
[8] Congressional Budget Office. (2017). Budget. Washington, DC: U.S. Government Printing Office. Retrieved from https://www.cbo.gov/topics/budget. (accessed August 30, 2017).
[9] Congressional Budget Office. (2015). CBO’s Economic Forecasting Record: 2015 Update: A CBO study (CBO Publication No. 49891). Washington, DC: U.S. Government Printing Office. Retrieved from https://www.cbo.gov/sites/default/files/114th-congress-2015-2016/reports/49891-Forecasting_Record_2015.pdf.
[10] Davies, Antony and Harrigan, James R. “Don’t Buy Budget Optimism: Not only are the CBO debt projections likely wrong, they’re wrong by a long shot.” U.S. News 1 Feb. 2017. Retrieved from https://www.usnews.com/opinion/economic-intelligence/articles/2017-02-01/the-cbo-federal-budget-predictions-are-dangerously-optimistic.
[11] Public Plans Data. 2001-2016. Center for Retirement Research at Boston College, Center for State and Local Government Excellence, and National Association of State Retirement Administrators.
[12] Rauh, Joshua D. (2017). Hidden Debt, Hidden Deficits: 2017 Edition. Stanford, CA: Hoover Institution, Stanford University. Retrieved from http://www.hoover.org/sites/de…
[13] Munnell, Alicia H. and Aubry, Jean-Pierre. (2016). Issue Brief: The Funding of State and Local Pensions: 2015-2020. Washington, DC: Center for State & Local Government Excellence. Retrieved from http://slge.org/wp-content/upl…
[14] Baily, Martin Neil, Litan, Robert E. and Johnson, Matthew. The Origins of the Financial Crisis. Initiative on Business and Public Policy at Brookings, Fixing Finance Series, Paper 3, November 2008. Retrieved from https://www.brookings.edu/wp-content/uploads/2016/06/11_origins_crisis_baily_litan.pdf.
[15] Pension Task Force. (2016). Report of the Pension Task Force of the Actuarial Standards Board. Washington, DC: Actuarial Standards Board. Retrieved from http://www.actuarialstandardsb…
[16] Rauh, Joshua D. (2017). Hidden Debt, Hidden Deficits: 2017 Edition. Stanford, CA: Hoover Institution, Stanford University. Retrieved from http://www.hoover.org/sites/default/files/research/docs/rauh_hiddendebt2017_final_webreadypdf1.pdf.
[17] Naucler, Tomas and Enkvist, Per_Anders. (2013). Pathways to a low-carbon economy: Version 2 of the global greenhouse gas abatement cost curve. McKinsey & Company. Retrieved from http://www.mckinsey.com/business-functions/sustainability-and-resource-productivity/our-insights/pathways-to-a-low-carbon-economy.
[18] United Nations Framework Convention on Climate Change. October, 2016. p. 2. Retrieved from http://unfccc.int/files/meetin… See also, Ifill, Gwen. “Why 2 degrees Celsius is climate change’s magic number.” WETA. PBS Newshour. 2 December 2015. http://www.pbs.org/newshour/bb…
[19] The $2.23 trillion estimate was arrived at by: (1) taking the McKinsey report’s 20 year investment schedule in abatement technologies for North America from 2011 to 2030 (Assumed the 2021 to 2025 investment schedule was same as the 2026 to 2030 schedule. No investment schedule was given in report for 2021 to 2025); (2) estimating the U.S. share of the scheduled investments to be 90 percent based on U.S. share of North American carbon emissions; (3) converting euros to dollars at the report’s stated exchange rate of 1.5 USD/EUR; (4) calculating the present value of these cash flows to be $2 trillion, using the average 2010 20-year Treasury rate as the discount rate; and (5) adjusting the 2010 $2 trillion estimate for U.S. inflation by expressing the result in 2017 dollars.
[20] US Department of Commerce, National Oceanic and Atmospheric Administration. “What Percentage of the American Population Lives near the Coast?” NOAA’s National Ocean Service, United States Department of Commerce, 1 June 2013, oceanservice.noaa.gov/facts/population.html.
[21] The Copenhagen Diagnosis, 2009: Updating the World on the Latest Climate Science. I. Allison, N.L. Bindoff, R.A. Bindschadler, P.M. Cox, N. de Noblet, M.H. England, J.E. Francis, N. Gruber, A.M. Haywood, D.J. Karoly, G. Kaser, C. Le Quéré, T.M. Lenton, M.E. Mann, B.I. McNeil, A.J. Pitman, S. Rahmstorf, E. Rignot, H.J. Schellnhuber, S.H. Schneider, S.C. Sherwood, R.C.J. Somerville, K. Steffen, E.J. Steig, M. Visbeck, A.J. Weaver. The University of New South Wales Climate Change Research Centre (CCRC), Sydney, Australia, 60pp.
[22] Cook, John. “How much will sea levels rise in the 21st Century?” Skeptical Science. 12 July 2015. Retrieved from https://www.skepticalscience.com/sea-level-rise-predictions.htm.
[23] U.S. Bureau of Economic Analysis, “Table 1.1.5. Gross Domestic Product,” https://bea.gov/iTable/iTable…. (accessed August 30, 2017).
[24] Kahneman, Daniel. Thinking Fast and Slow. Farrar, Straus and Giroux. 2011.
[25] Haidt, Jonathan. The Righteous Mind: Why Good People Are Divided By Politics and Religion. New York: Pantheon Books, 2012.
[26] For a thorough recent discussion of how self-interest can paralyze decision-making see: C.L. Exley and J.B. Kessler. “The better is the enemy of the good.” Working Paper, Harvard Business School and Wharton Business School. August 27, 2017. Available at https://hceconomics.uchicago.e… And N Barak-Corren, Chia-Jung Tsay, Fiery Cushman, and Max H Bazerman.” If You’re Going to Do Wrong, at Least Do it Right: Considering Two Moral Dilemmas at the Same Time Promotes Moral Consistency.” Management Science. May 2015. https://doi.org/10.1287/mnsc.2… Note also that the U.S. government’s long-standing influenza vaccination policy similarly optimizes political self-interest by concentrating on the elderly. While the elderly have the largest chance of mortality, children are the primary transmitters of the diseases, and focusing on this population would benefit society’s health the most. This decision is considered morally acceptable because the personal utility of vaccination is higher for elderly who vote at higher rates than parents of young children.
[27] Chudik, A, Mohaddes, K, Pesaran, M. H., and Raissi. M. “Is There a Debt-threshold Effect on Output Growth?” Cambridge Working Papers in Economics. July 3, 2015. p. 21. https://www.repository.cam.ac….
[28] OECD, “Life expectancy at birth (indicator). doi: 10.1787/27e0fc9d-en,” 2017. [Online]. Available: https://data.oecd.org/healthstat/life-expectancy-at-birth.htm#indicator-chart. [Accessed 2 August 2017].
[29] OECD, “Infant mortality rates (indicator). doi: 10.1787/83dea506-en,” 2017. [Online]. Available: https://data.oecd.org/healthstat/infant-mortality-rates.htm#indicator-chart. [Accessed 2017 August 2017].
[30] OECD, “Education at a Glance 2016: OECD Indicators,” OECD Publishing, Paris, 2016.
[31] DOD, “Population Representation in the Military Services: Fiscal Year 2013 Summary Report,” Department of Defense (DOD) report, 2013. https://www.cna.org/pop-rep/20…