
Which households are more exposed to financial risk and to what extent is their debt systemically relevant?
After a period of stability that lasted through the first half of the ‘80s, US household debt as a ratio of household income started increasing from 1984 (when it was at 70%), and then surged in the years 1999-2007 (reaching 123%). In the wake of the 2007-2008 crisis, there was a small decrease (by 12%: from a total of $12.68 trillion in the third quarter of 2008 to $11.15 in the second quarter of 2013), but it quickly returned on its upward trend to total $17.3 trillion today.
The broad trend displays more specific ups and downs in the composition and dynamics of different types of household debt. For example, a declining trend in mortgages as a ratio of household incomes set in after the 2007-2008 global financial crisis. This continued through 2019. By contrast, consumer credit started growing again as early as 2012, reaching a new high of 25% of the national income and product accounts (NIPA) disposable personal income in 2017, at just below $4 trillion. The largest component of this debt is education loans, which surpassed auto loans in 2009.
The size, persistence, and pervasiveness of household debt in the US is an important, even crucial, phenomenon to study, if we want to reduce financial instability and devise appropriate policies to reduce inequality and improve the welfare of the population.
Unfortunately, there is little consensus about the drivers and implications of household debt. Even before the 2007-2008 crisis, mainstream economists compared houses to ATMs due to the ease of refinancing mortgages in the USA. The archetypal idea was that of households cashing in on the increase in the market price of their houses, possibly to indulge in conspicuous consumption or in consumption smoothing and anyway without reference to the complex financial products sold by banks to the market, which made refinancing so easy in the first place. After the crisis erupted, the focus shifted to “predatory lending” epitomized by mortgages granted to households with No Income, No Job, No Assets (NINJA). More sympathetic observers have attributed the loan demand from these households to desires to “keep up with the Joneses” or maintain previous standards of living in a context of wildly growing inequality.
Either way, economists have assumed the existence of speculative behavior on the side of middle-class or low-income class households, respectively.
In our new INET Working Paper, we advance and test a different view. We explore the two assumptions of speculation and emulation but also look carefully at reasons for falling into over-indebtedness that have nothing to do with speculation: crucially, the role of sheer poverty and incompressible expenses. Those expenses are linked to the need to cover basic costs of living, for precautionary motives (private social security) or to invest in education, in a context in which the public sector does not provide adequate support. But they also include debt servicing costs, which clearly reflect policy choices.
We consider these several explanations for household debt in relation to an original definition of social stratification, which transcends the usual groupings based on relative income levels. We want to treat household debt as a macroeconomic phenomenon: given a certain portfolio structure, the financial behavior of a household and the sustainability of its budget depends crucially on the public policies in place, on employment trends, and on the household’s social position. This broader social class approach to debt is critical to our macroeconomic reading of the observed phenomena.
According to a seminal stratification scheme developed by Fessler and Schürz (2017), households could have no assets; they could own a home; or they could own real estate, a business, and/or financial wealth. In the paper, we adopt and develop their framework, we assume that each class of assets serves a specific function (earning an income, saving on costs, or precautionary savings) and allow for the possibility that the debt associated with the different kinds of assets may be driven by different factors. Accordingly, we classify households into propertyless, homeowners, and business and/or wealth owners. In other words, we classify households based on the function of the assets they own, which are associated with the types of incomes they receive and the motives for which they have taken on and accumulated debt.
As shown in Figure 1, panel a, all classes of households have seen their debt, expressed in 2019 dollars, grow constantly, an exception only in the 2007-2008 crisis. Homeowners collectively own the biggest slice of debt, larger than $7,500 billion already before the Covid pandemic; wealth or business owners follow with roughly 2/3 of that amount (around $5,000 bn before the pandemic), while the propertyless, despite averaging 1/3 of the population, own but a fraction of the other two classes’ debt – presumably because of their inability to provide collateral. Among the haves, the ranking is reversed if we consider average debt or, as in Figure 1.b, debt as a ratio to income. Between ups and downs, this indicator too has increased for all classes in the long run, with debt reaching the equivalent of 1.5 years of income on average for the homeowners, and 2 years for the business and/or wealth owners.
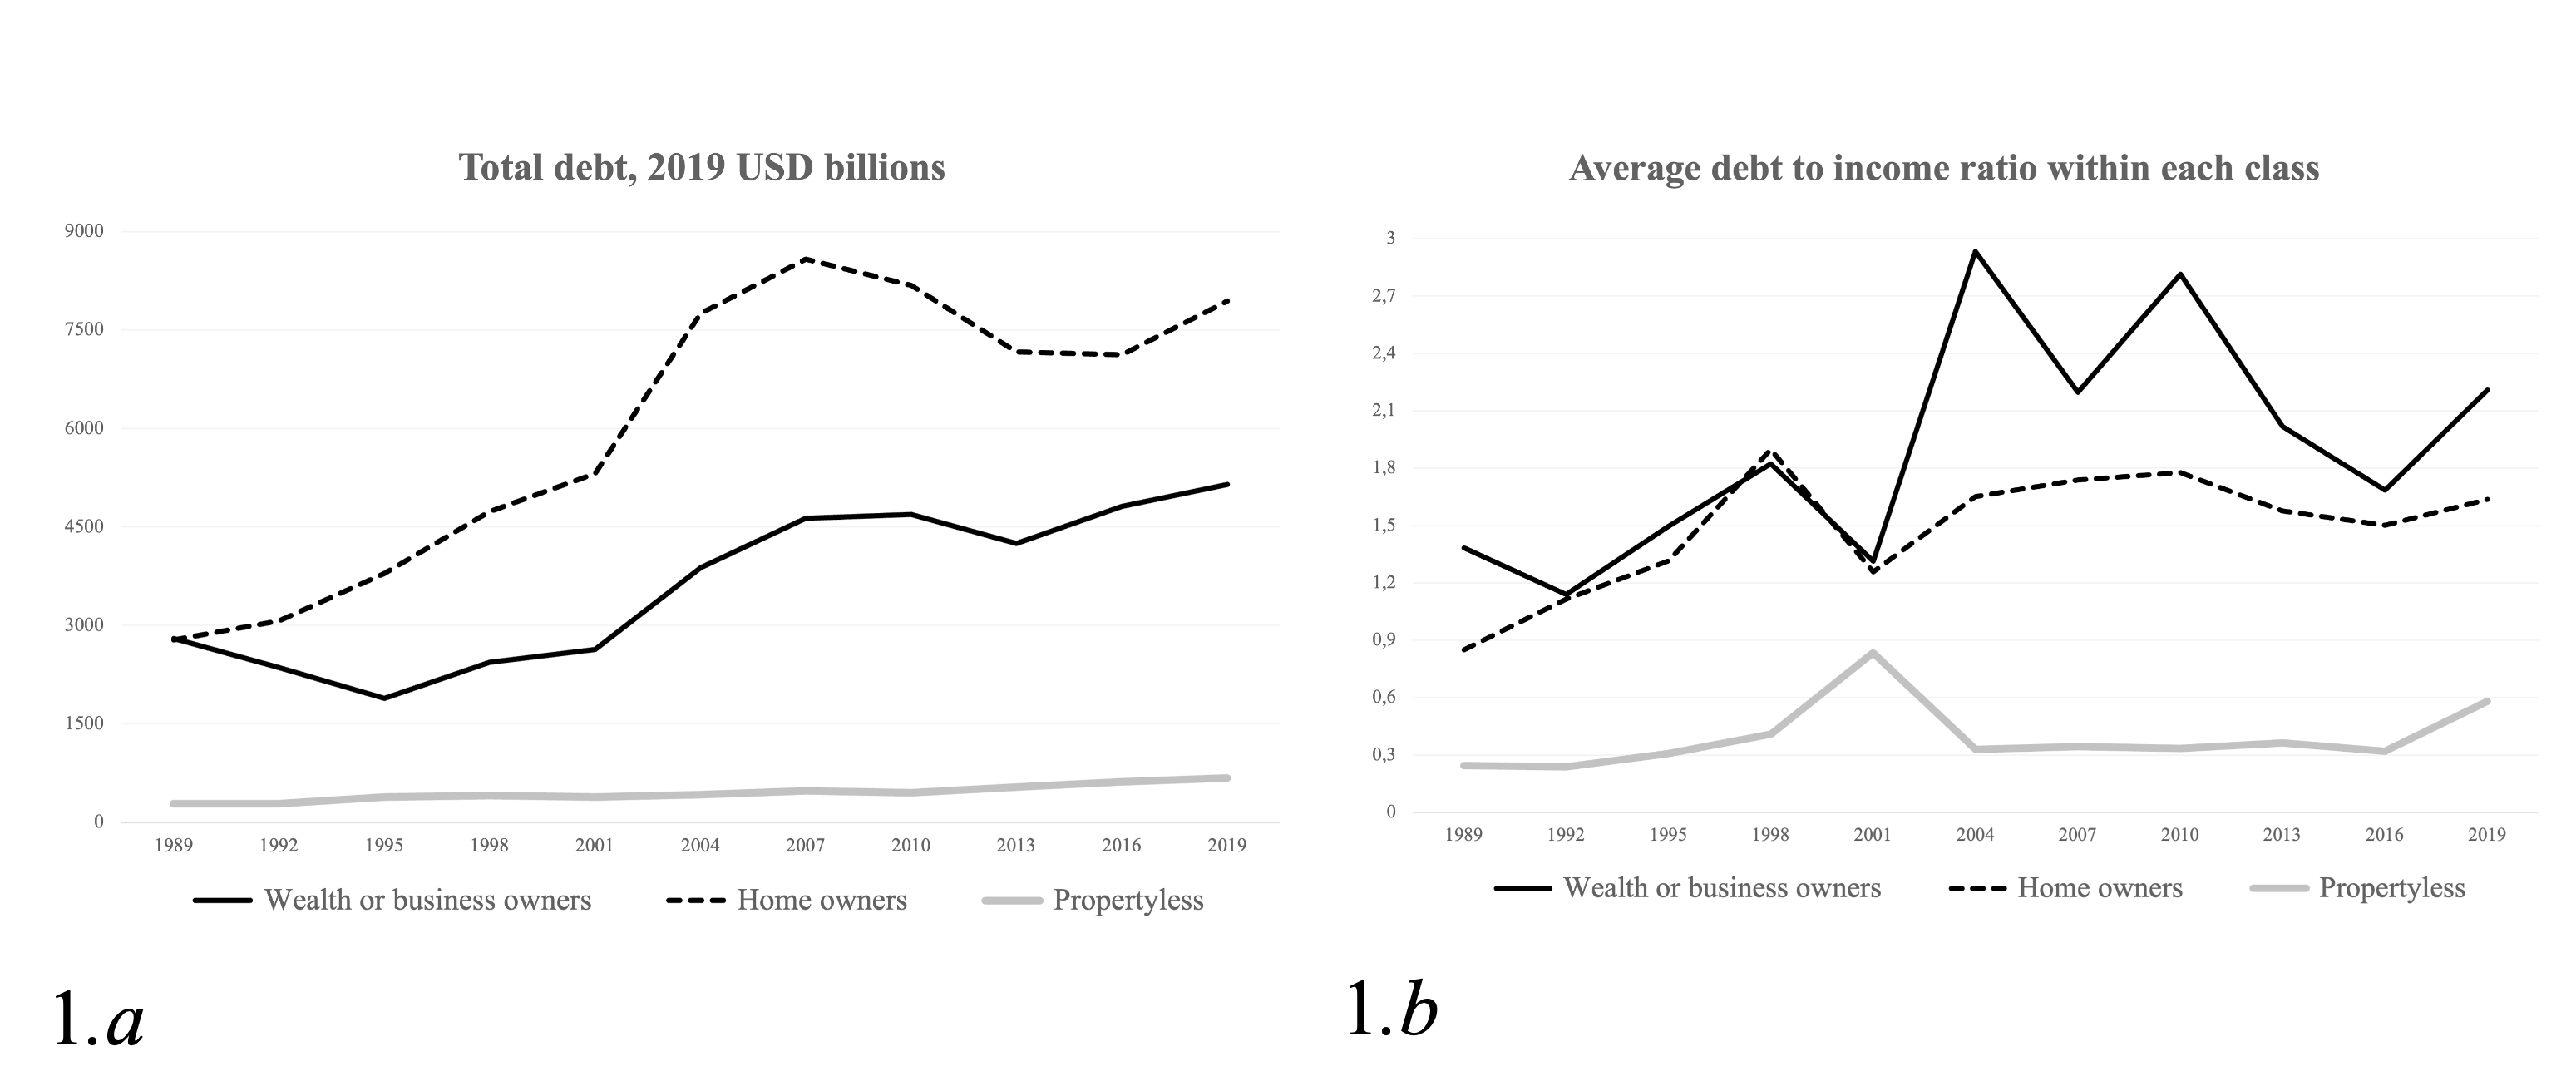
Figure 1
With econometric estimates detailed in the working paper, we find that poverty and/or the pressure of incompressible expenses – such as contractual commitments on rents or debt repayments – are the primary reasons for incurring debt. Significantly, this applies to all classes, highlighting that debt could be particularly a problem of asset-rich and income-poor households. In addition, those who own at least a house or financial wealth can increase debt in response to a negative shock to their income, while such shocks have no impact on the debt of the propertyless, signaling credit rationing.
We also find that emulation and conspicuous consumption are statistically significant predictors of debt that, however, explain only a very minor part of households’ indebtedness. Instead, we highlight the crucial role of financial fragility, especially in the form of a “snowball effect” that takes hold when the interest payments on past debt are higher than the growth in a household’s income, potentially leading to a debt trap in which the household has to incur new debt in order to service older debt.
Our results confirm the crucial role of poverty and inequality in shaping household indebtedness, but not for the speculative motive often invoked. The evidence that all classes, but especially the propertyless, go into debt not only because they overspend, but also to make ends meet, is troubling. In this case, credit functions as a welfare provider of last resort for those without assets or with negative equity. From a macroeconomic point of view, such credit-fueled household spending provides a smooth flow of revenues to the financialized corporate and rentier sectors, for a range of services and debt repayment, which is essentially inelastic to changes in household real incomes. This is the reality behind the pronounced fragility of US household finances amidst macroeconomic or institutional shocks.
Our research supports the conclusion that policies attempting to reduce financial fragility cannot be limited to financial regulation to stabilize asset prices. They must tackle the structure of aggregate demand and the sources of income inequality. Those policies, however, must also consider the effect that new productive and employment-creating investments may have on the real incomes of many families in the short to medium term, in such a chronically financialized (and concentrated) economy. To that end, measures such as price capping and reinforced provision of free or cheap public services should be devised.
We frankly acknowledge that our study has some limitations, especially due to data availability in the Federal Reserve Survey of Consumer Finances, as we point out several times in the paper. Nevertheless, we hope that this work can provide a valuable framework and a sound methodology that can be further tested and improved by application to different datasets. We are sure that further study of the role social class plays in debt will be invaluable. One could, for example, use a survey, such as the Fed’s Consumer Credit Panel, that observes the same households over time, thus providing insights into how situations change due to macroeconomic fluctuations and changes in social class status. The analysis of the impact of relative poverty and available equivalent income could be further specified by more analysis of the consumption behavior of households and their occupational and employment benefits.