While the heightened interest is somewhat new, economists have, for the last several decades, begun to not simply document the degree of inequality but also to reconsider the impact of inequality on national economic growth. In particular, while traditional models have long suggested that a skewed distribution of income, however politically or morally distasteful, at least generates investment and economic expansion, a new body of literature has been suggesting that inequality dampens investment in human capital, constrains credit markets, and creates political stresses that can slow growth and derail macroeconomic adjustment.
Much of this literature has been cross-national, often with a particular focus on the developing world. But another wave of work also has been examining the relationship between social equity and economic growth at a metropolitan scale in the United States. See some of our previous work on this topic. Different measures of equity have been considered, including income inequality, racial inclusion, and spatial segregation by race, income or jurisdiction, with the general pattern being that various measures of disparity are correlated with – and, in some of the work, causally related to – slower economic growth.
These metro-level studies have focused primarily on the pace of growth, but researchers also have recently turned their attention to “resilience,” or the capacity of regions to maintain growth paths in light of external shocks. An interesting parallel has occurred in the international literature, with recent work by researchers at the International Monetary Fund (see here and here) focused on the length of “growth spells.” The reason is that maintaining growth may be especially critical for the poor countries of the world, partly because countries with more sustained growth spells may create an environment where investors feel more secure about the future, facilitating a virtuous cycle.
This interest in growth sustainability, however, has returned us to the social context undergirding economic life. In a remarkable study looking at 104 distinct “growth spells” (periods of at least five years of annualized growth) in a total of 140 countries (both industrial and developing) since the 1950s, IMF-based researchers found that many factors might explain why a country could fall out of a growth spell, including external shocks, political and economic institutions, and levels of financial development. However, the single most statistically significant, important, and consistent limiting factor was a high level of initial inequality.
In recent work, we have applied the empirical strategies pioneered by IMF researchers to look at growth sustainability in 184 American metropolitan regions over the period of 1990-2011. We considered a region to be experiencing a full growth spell if it had at least 12 quarters of uninterrupted employment growth, measured by comparing employment to the same quarter a year earlier to control for seasonal variations in production.
Do such growth spells really matter?
One might argue that the length of growth is of little consequence – perhaps a “boom and bust” economy is volatile but it will deliver high employment and wages over time. In Chart 1, we break the growth spells into categories, based on the number of quarters in the overall period that a region was in one. We then calculate the growth in employment over the entire 1990-2011 period. The data suggests that more time in growth spells generates more overall growth in employment. Parallel calculations, not shown here, connect sustainable growth to larger increases in earnings as well.
If growth spells are good, what determines their length? We examined indicators of a range of possible factors, including: external shocks and vulnerability; political fragmentation; inequality and separation; social indicators; and economic structure and institutions. Chart 2 shows the results of our analysis, which used a survival analysis regression method to see which factors are associated with an early exit from sustained growth. The chart shows “hazard ratios” — when the value is greater than one, it means the variable being tested is associated with falling out of a growth spell, and when the coefficient is less than one, the variable being tested is associated with staying longer in a growth spell. (The darker the color of the bar, the more statistically significant the relationship is, which is also indicated in parentheses.)
As can be seen, we found that growth duration is positively related to a number of factors one might expect, including lower levels of reliance on manufacturing and a higher proportion of the population with middle education levels. However, we also found that the length of growth spells is strongly related to lower levels of metropolitan income inequality and lower levels of social and spatial segregation. The most striking finding is the measure of income inequality, as indicated by the high coefficient and significance level of a regional Gini coefficient of income inequality.
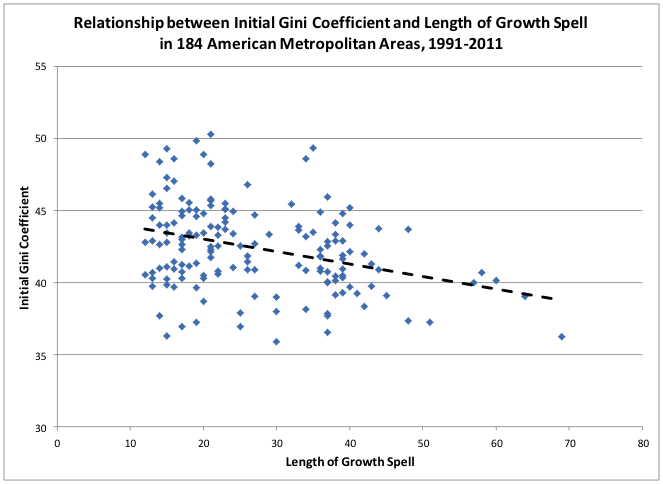
Chart 3 shows the raw relationship between the length of growth spells and the initial Gini coefficient (we are careful with all the variables to use 1990 starting points for growth spells that began in that decade and 2000 starting points for growth spells starting in the subsequent decade.) While it likely overstates the relationship due to lack of controls, it shows why the empirical finding is not that surprising.
Overall, our research suggests that more equitable and integrated regions are better able to sustain growth. Our conclusions are necessarily tentative (as were those in the IMF study.) But we hope this will encourage more research and theorizing about whether more equitable, integrated, and spatially connected regions–which we might prefer for other reasons as well—may also be able to achieve more sustained economic growth.
Chart 1: Growth Spells and Growth Rates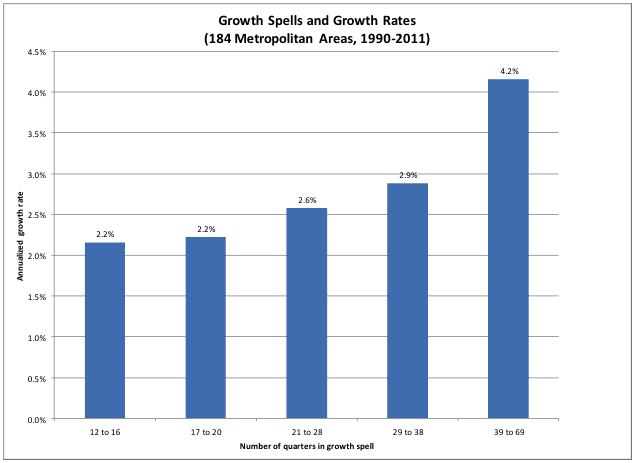
Chart 2: Factors Associated with the Length of Growth Spell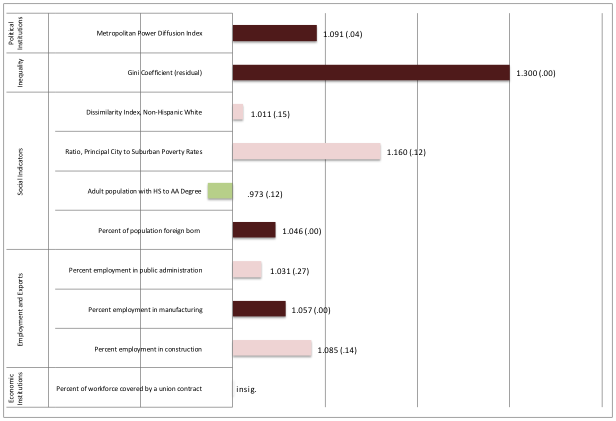
Chart 3: Growth Spells and Inequality