
Inflation and corporate profits, a further discussion
“Pricing will be an important lever for us this year and is expected to drive most of our growth.”
— Hershey CEO Michele Buck
“Most of our – if not all – of our net sales growth for 2022 would be driven by price/mix.”
— Amit Banati, CFO Kelogg’s. (Source: Perkins 2022)
Unprecedented increases in (corporate) profits during 2020-2023 are stirring up discussions and debates in newspapers, policy circles, and the blogosphere. ‘Profit inflation’, ‘sellers’ inflation’, or ‘greedflation’ in the vernacular, are having quite the moment—that is, claims that corporate profiteering has significantly contributed to our current inflationary moment, have been getting real currency. For example, Christine Lagarde, the President of the European Central Bank (ECB), stated (on May 4, 2023; see Partington and Waerden 2023) that “In some sectors, firms have been able to increase their profit margins on the back of mismatches between supply and demand, and the uncertainty created by high and volatile inflation.” In another statement (June 5, 2023), Lagarde doubles down on her claim, pointing out that “….sectors have taken advantage to push costs through entirely without squeezing on margins, and for some of them to push prices higher than just the cost-push” (Allenbach-Ammann 2023). Philip Lane, the Chief Economist of the ECB, adds that “many firms had been able to raise their profit margins in sectors faced with constrained supply and resurgent demand. Lane further argues that “wages had had only a limited influence on inflation over the past two years and […] the increase in profits had been significantly more dynamic” (Randow and Eglitis 2023)
Unfortunately, the debate on ‘profit inflation’ is mired in conceptual unclarities, definitional idiosyncrasies, and data problems—and combinations and perturbations of these. In a much-debated intervention, Marc Lavoie attempts to bring clarity to the debate on profit inflation. His intervention is helpful in pointing out why profits and the profit share may increase in times of rising prices of energy and materials, even if corporations keep their markup rates constant and do not take advantage of the “uncertainty created by high and volatile inflation.” Lavoie thinks that this is the case: most of the evidence, in his view, shows that the increase in inflation can be explained by higher profit share growth, which itself was driven by higher prices of intermediate inputs (and energy, in particular). If true, this would mean that firms did not increase their profit markups. Hence, in essence, Lavoie is saying that economists should not get carried away by what could be a momentary fad—but instead should diagnose what is happening based on clearly defined and operational concepts.
Lavoie’s point matters, in my view, especially if we take his intervention as a call to have a conceptually clearer debate. However, empirically, his claim that “in general, the rise in profits and the profit share can be explained without resorting to an explanation based on firms taking advantage of the situation and raising markup rates” is wrong, at least for the U.S.—as the remainder of this note will show.
Profit share inflation
Let me start by defining our measure of the price level in terms of the gross output price:
(1) ρ=(1+τ)(β w+ αρM)
where ρ = the gross output price; τ = the mark-up; w = the nominal wage per hour worked; β = hours worked per unit of gross output; ρM = the average price of intermediate (energy) inputs; and α= intermediate (energy) inputs per unit of gross output. In the tradition of cost-plus pricing, firms add a markup to variable cost per unit of gross output (β w+ αρM). The markup may be determined by the degree of monopoly (Kalecki) or by the price elasticity of demand (Lerner)—or in some other manner. Crucially, the gross output price includes intermediate (energy) cost per unit of output, along with unit labor cost. The bone of contention in the debate on profit inflation is whether the markup rate τ has remained constant (as Lavoie argues) or increased (which is what Lagarde and Lane appear to argue).
It is clear from eq. (1) that the gross output price will increase following a rise in the price of intermediate (energy) inputs ρM. In fact, ∂p/(∂ρM )=(1+τ) α>0, assuming that the profit markup remains constant. It is equally evident that the gross output price will increase in response to an increase in the markup: ∂p/∂τ=(β w+ α ρM)>0.
Let us define ‘profit inflation’ strictly as an increase in the gross output price that is caused by an increase in the profit markup (keeping all other unit cost items constant).
Based on equation (1), we can further define the profit share π in gross value added as follows:
(2) π=(τ (β w+ α p_M))/(β w+ τ (β w+ α ρM))
where β w = labor cost per unit of gross output; α ρM = intermediate (energy) input cost per unit of gross output; and β w+ τ (β w+ α ρM) = value added per unit of gross output. The expression τ (β w+ α ρM) = profits per unit of gross output.
It follows from eq. (2) that the profit share π must rise in response to a rise in ρM (ceteris paribus). To see this, consider the sign of derivative of π with respect to ρM:
(3) ∂π/(∂ρM)=(τ α β w)/[β w+ τ (β w+ α ρM )]^2 >0
Again, we are assuming that the profit markup remains constant. What eq. (3) shows is that the profit share (in value-added) will increase in response to an increase in the price of intermediate (energy) inputs when the profit markup remains constant. This is Lavoie’s point: a higher price of intermediate (energy) inputs will raise the gross output price and at the same raise the profit share (in value-added), even if the markup remains constant.
As a result, the optics of the rise in the gross output price turn out to be rather misleading: the rising profit share suggests that the inflation is due to ‘profit inflation’, but this is not the case in this example—because the markup did not rise.
To see why this is important, consider Figure 1 which presents evidence on the contributions of unit labor cost, unit non-labor cost, and corporate profits to the growth of the real GDP deflator for the U.S. economy. These contributions have been calculated based on Table 1.15. “Price, Costs, and Profit Per Unit of Real Gross Value Added of Nonfinancial Domestic Corporate Business” (Bureau of Economic Analysis or BEA). The evidence shows that the growth of the profit share (in gross value added) is responsible for more than 40% of the increase in the GDP deflator during 2020Q1-2022Q2.
Can we take this single piece of evidence as proof of the claim that there has been profit inflation? The answer is negative—as Lavoie points out—because the rise in the profit share (which is what Figure 1 reports) could, in principle, have completely been due to rising prices of intermediate (energy) inputs.
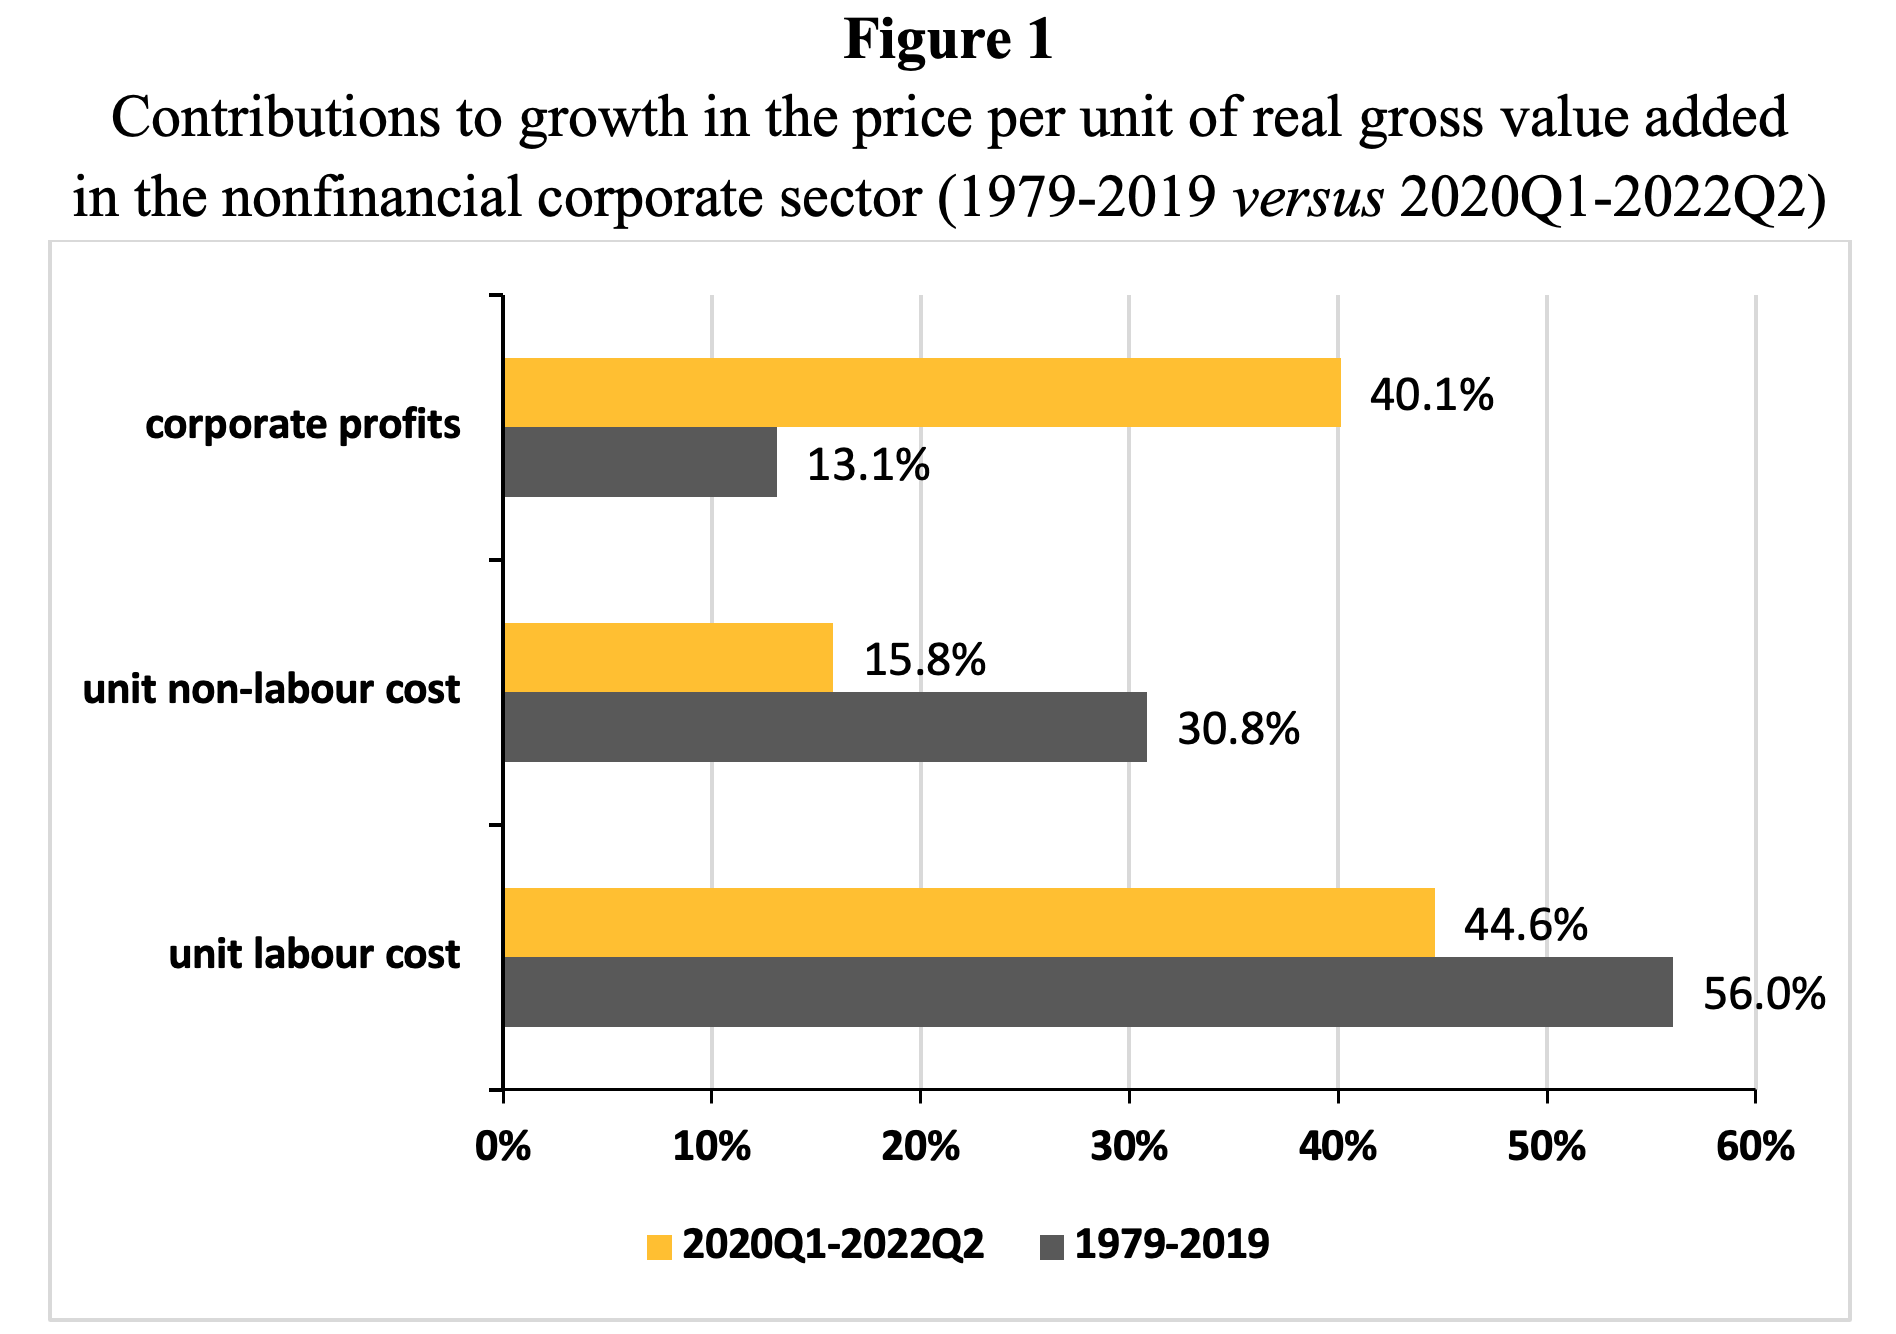
Source: Based on Bivens (2022). Calculated using data from Table 1.15 from the National Income and Product Accounts (NIPA) of BEA. Note: unit non-labor cost includes depreciation, taxes on production less subsidies and net interest and miscellaneous payments.
Accordingly, based on solely Figure 1, it would be wrong to conclude that recent inflation in the U.S. is driven by profit inflation. I have to insert a mea culpa, because I drew that inference from Figure 1 in Storm (2022). But the mistake is more commonly made, which is probably also the reason why Lavoie decided to intervene in this debate.
For example, a recent econometric analysis by Angela Capolongo, Michael Kuehl, and Vlad Skovorodov (2023), three economists working at the European Stability Mechanism (ESM), claims to identify rising profit mark-ups as the main driver of inflation in the Eurozone. The authors conclude that Eurozone inflation is to a considerable degree due to
“the rise in firms’ pricing power – their ability to pass changes in costs to the consumer without harming sales – both domestically and abroad. This factor became the most important driver of profit margins since the beginning of 2022.”
However, what they are measuring is the increase in the profit share (or unit profit in GDP)—which may have increased primarily due to higher intermediate input prices and not because of increases in the profit markup. Their inference is wrong because their numbers are not saying anything about changes in the markups and rises in firms’ pricing power.
ECB economists Oscar Arce, Elke Hahn and Gerrit Koester (2023) similarly get carried away—arguing that profit mark-ups rose and drove up the GDP deflator of the Eurozone while pointing to data on increases in the profit share. Because their analysis does not include the effects on the profit share of higher prices of intermediate (energy) inputs, they cannot infer anything concerning the role played by rising profit mark-ups.
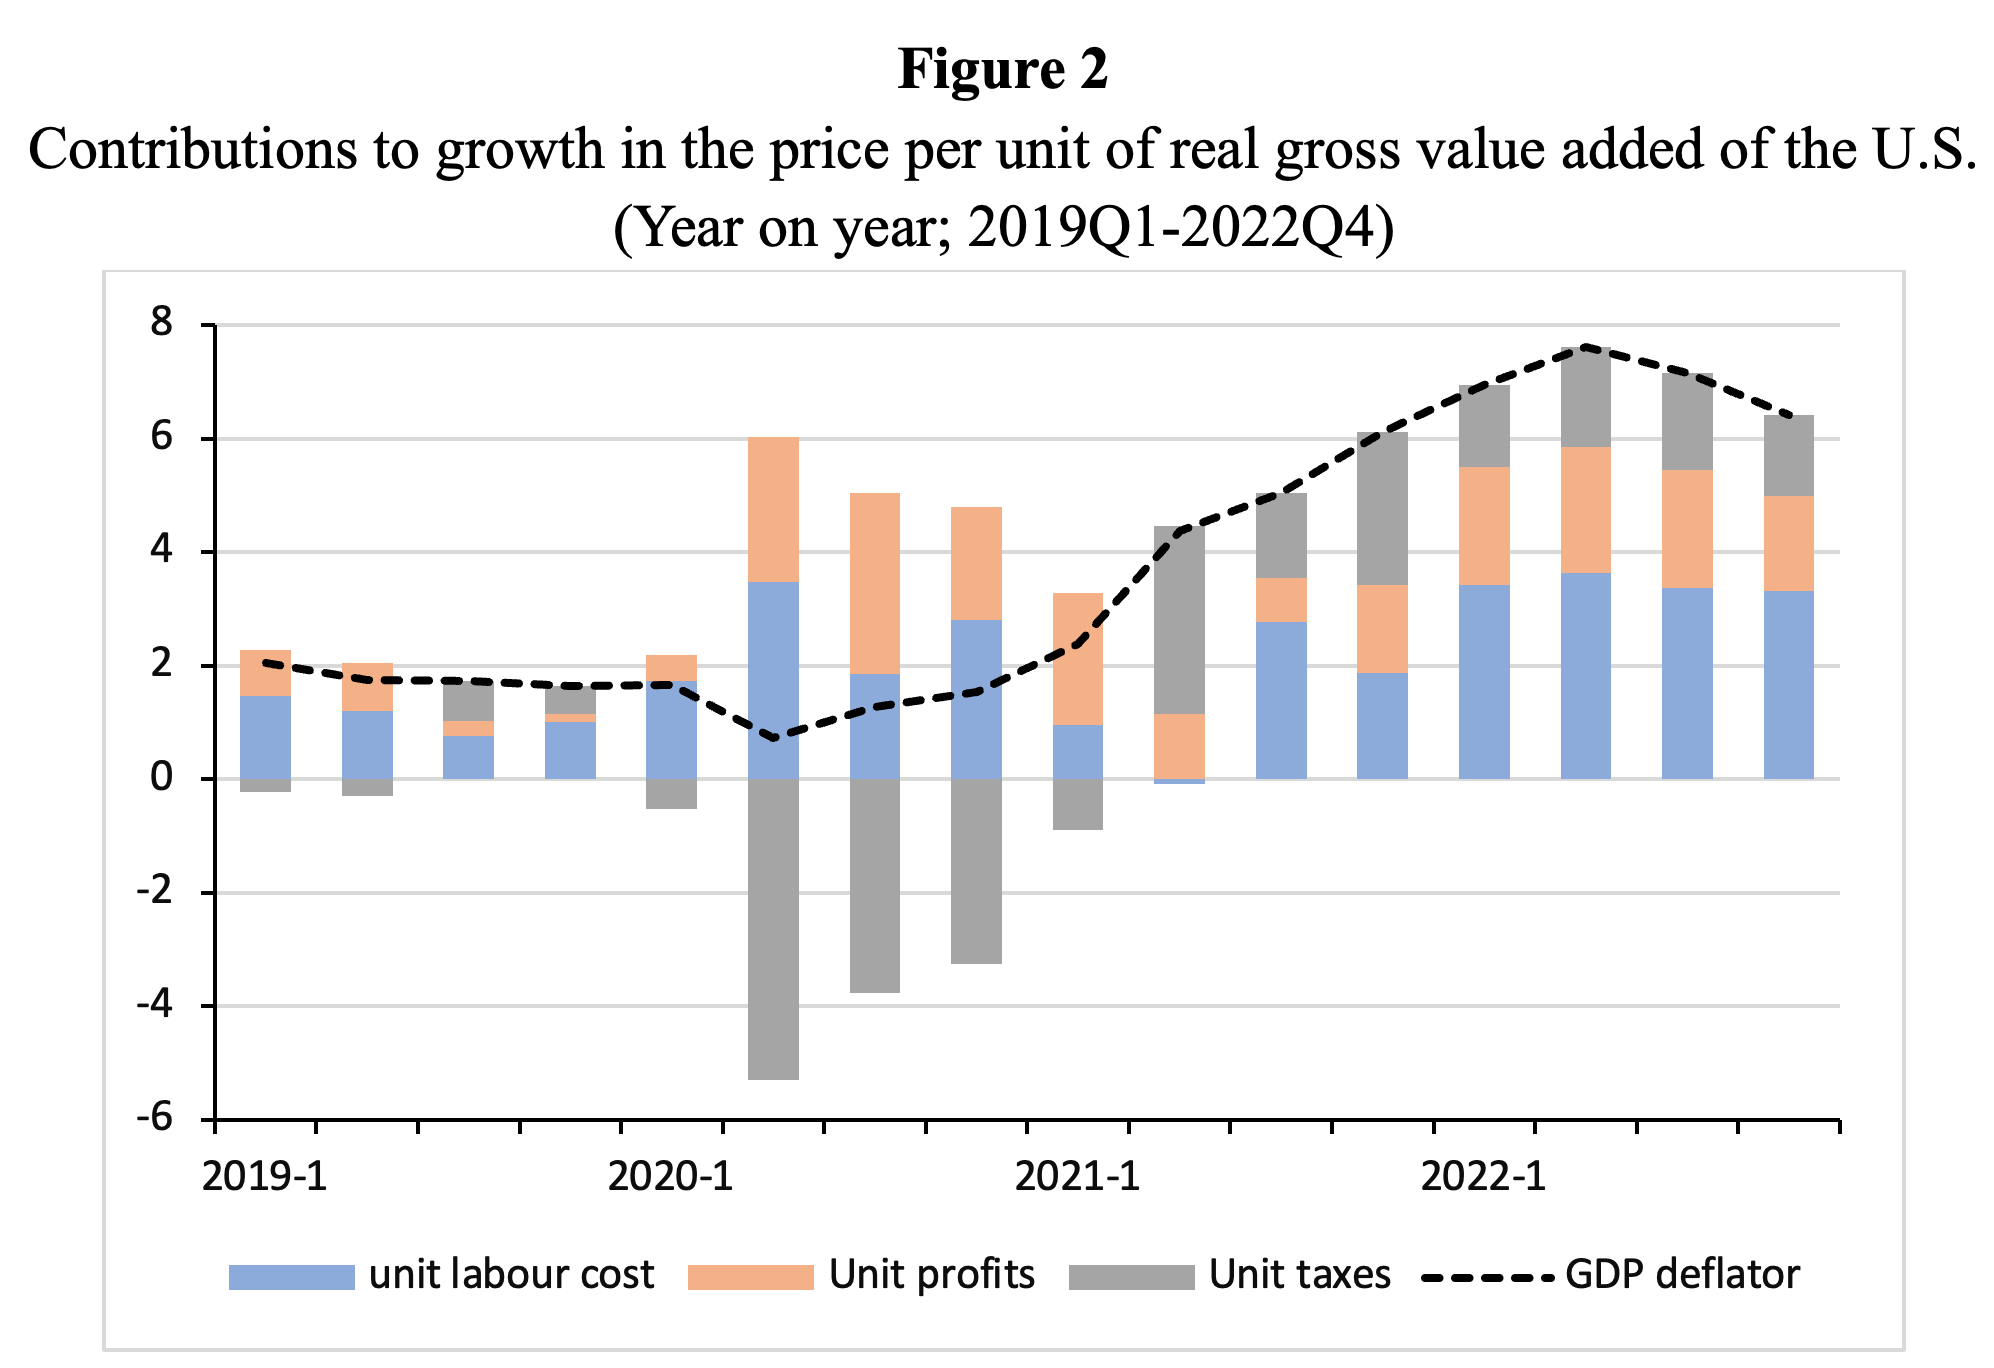
Source: OECD (2023), Economic Outlook June, Box 1.2.
The OECD does a somewhat better job than the ESM and ECB. In Box 1.2 of the Economic Outlook of June 2023, the OECD (2023, pp. 26-30) uses an approach similar to the one underlying Figure 1, to estimate the contribution of unit profit growth to GDP deflator inflation. The OECD findings in Figure 2 are similar to those reported in Figure 1. The OECD (2023, p.) 27) correctly warns, following Colonna, Torrini and Viviano (2023), that “an increase in unit profits (profits per unit of value added) does not necessarily entail higher profit margins (profits as a proportion of sales) as the increase of input costs (including intermediate consumption) can result in profits per unit of value-added moving differently to profits on gross output (or sales).” The OECD thus understands the point made by Lavoie, but then does not offer any empirical evidence on profit mark-up inflation (as defined here in this note).
However, it is important to be clear, at this point in the argument, that higher prices for intermediate (energy) inputs do not always push up the profit share as well as the gross output price. For this to happen, the profit markup has to remain constant (or the markup should not decline by so much as to offset the impacts of higher intermediate input cost). History teaches us that we cannot take it for granted that this is the case.
For instance, during the stagflationary 1970s, energy prices and commodity prices also rose considerably. In fact, according to BEA data, the price of intermediate (energy) inputs rose by 9.3% per year during 1972-1979 which is more than the average annual increase in intermediate input costs by 7.5% during 2020-2022. Now, consider Figure 3, which is similar to Figure 1, but with BEA data for the 1970s.
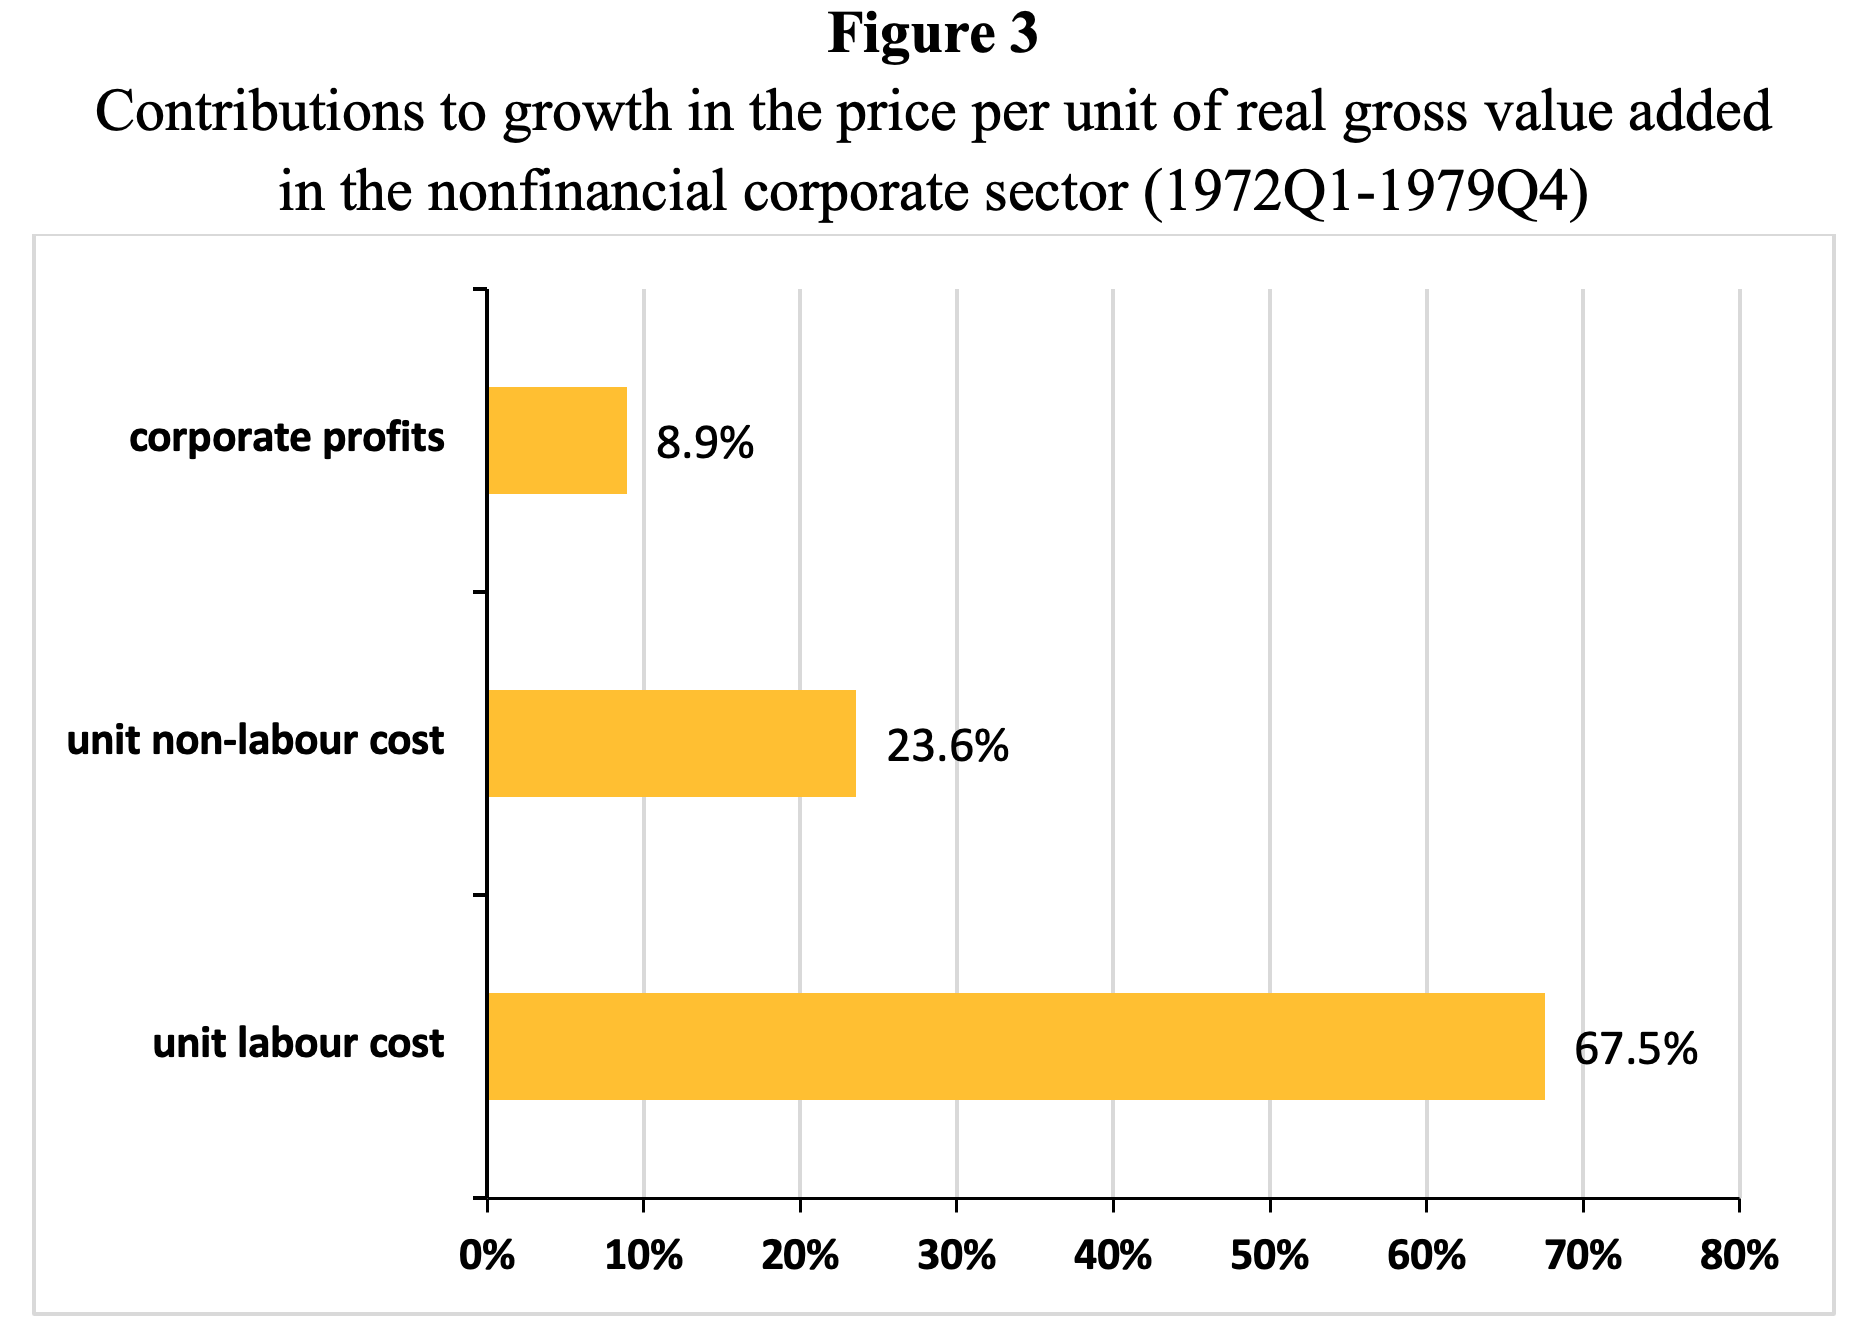
Source: Author’s estimates. Calculated using data from Table 1.15 from the National Income and Product Accounts (NIPA) of BEA.
It turns out that the contribution of profit share growth to the growth of the real GDP deflator was much smaller in the 1970s (only 9%) than it has been during 2020-2022 (more than 40%). To belabor the point: notwithstanding the higher growth in ρM during the 1970s (than during 2020-22), profit share growth during the 1970s does explain only 9% of the growth of the real GDP deflator compared to 40% during 2020-22.
Higher growth in ρM will only push up the profit share if all other factors are constant (see eq. (3)). But as the numbers in Figure 3 unmistakably indicate, other factors did not remain constant during the 1970s. Two key changes must be mentioned. First, higher nominal wage growth in the 1970s (compared to moderate and lagging nominal wage growth today) limited the increase in the profit share. Second, (large) corporations in the 1970s struggled to protect their profit mark-ups in the face of rising energy prices and higher nominal wages, whereas today (as we will see below) they have been able to defend, and even raise, their mark-ups in the face of higher intermediate (energy) prices.
A comparison of Figure 1 and Figure 3 shows how extraordinary our current inflationary distress actually has been and still is. That is, even if we suppose (for the moment) that corporations succeeded in maintaining their profit mark-ups, but were unable to raise them, we should recognize this for what it is: a remarkable achievement! Unlike during the 1970s, corporations today wield sufficient market power to effectively protect their profit mark-ups (and, by doing so, to realize higher profits) during a time of inflationary stress that is comparable to that of the 1970s.
We may agree to not call this ‘profit inflation’, but constant profit mark-ups still contribute to inflation and have regressive distributional implications (as the profit share goes up and the wage share goes down).
Enter the profit markup
Without additional information on the price of intermediate inputs, we cannot isolate the effect of mark-up increases on inflation. The good news is that the Bureau of Economic Analysis does provide the necessary data on gross output, intermediate inputs and gross value added that we need. It is therefore possible to estimate the components of the gross output price defined in eq. (1). Table 1 presents the results for ‘private industries.
Table 1
The gross output price and its components
(Private industries, 2020Q2 – 2022Q4; base year 2012 = 1)
| 2020-Q2 | 2020-Q3 | 2020-Q4 | 2021-Q1 | 2021-Q2 | 2021-Q3 | 2021-Q4 | 2022-Q1 | 2022-Q2 | 2022-Q3 | 2022-Q4 |
p | 1.086 | 1.100 | 1.114 | 1.134 | 1.163 | 1.187 | 1.210 | 1.239 | 1.272 | 1.280 | 1.281 |
β w | 0.370 | 0.355 | 0.356 | 0.345 | 0.340 | 0.338 | 0.337 | 0.333 | 0.326 | 0.330 | 0.331 |
α ρM | 0.433 | 0.427 | 0.436 | 0.441 | 0.444 | 0.449 | 0.445 | 0.453 | 0.458 | 0.454 | 0.447 |
1+τ | 1.247 | 1.278 | 1.263 | 1.272 | 1.276 | 1.271 | 1.278 | 1.273 | 1.275 | 1.274 | 1.285 |
|
|
|
|
|
|
|
|
|
|
|
|
| 0.349 | 0.380 | 0.369 | 0.383 | 0.389 | 0.387 | 0.392 | 0.392 | 0.398 | 0.395 | 0.401 |
Source: Author’s calculations based on BEA data from the Industry Economic Accounts. The BEA provides data on (nominal and real) gross output, value-added and intermediate inputs used by industry. Link: https://apps.bea.gov/iTable/?r…
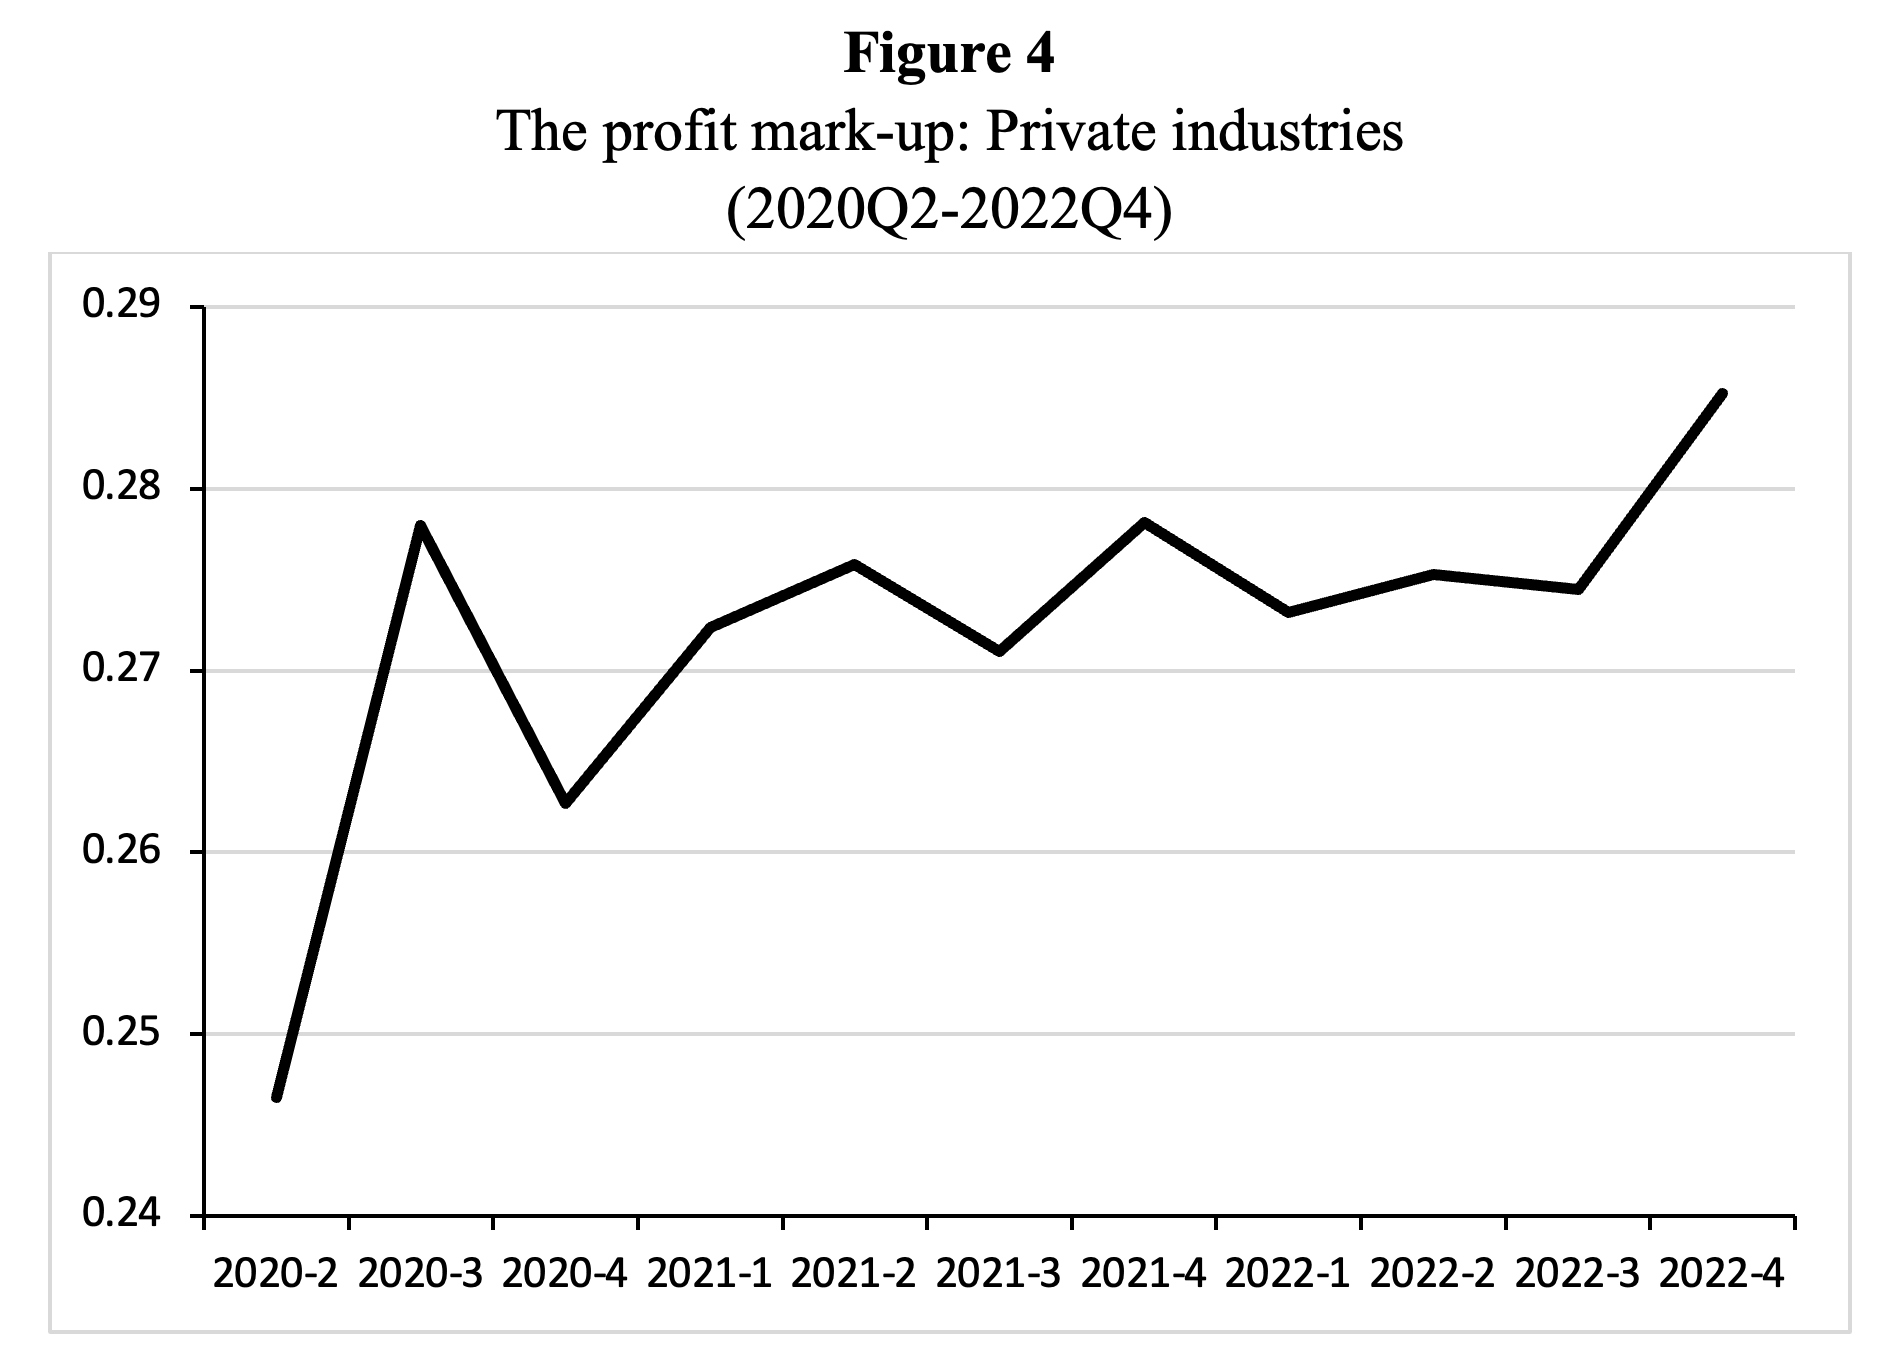
Source: Author’s estimates. Calculated using data from the National Income and Product Accounts (NIPA) of BEA.
It is clear from Table 1 as well as Figure 4 that the average profit markup used by ‘private industries’ in the U.S. has increased—from 0.247 in 2020Q2 to 0.285 in 2022Q4. This is an increase by 15.7% which has directly contributed to the increase in the gross output price (since ∂p/∂τ>0 from eq. (1)). Higher mark-ups have, therefore, added to the recent surge in U.S. inflation and (large) American firms have taken advantage of the situation, exactly as has been argued by Lagarde and Lane for the Eurozone.
This is not a surprise. Some CEOs have admitted on shareholder calls and in surveys that they have been taking advantage of inflation to raise profit margins by increasing prices beyond what is needed to offset any increase in their input costs (Ferguson and Storm 2023).
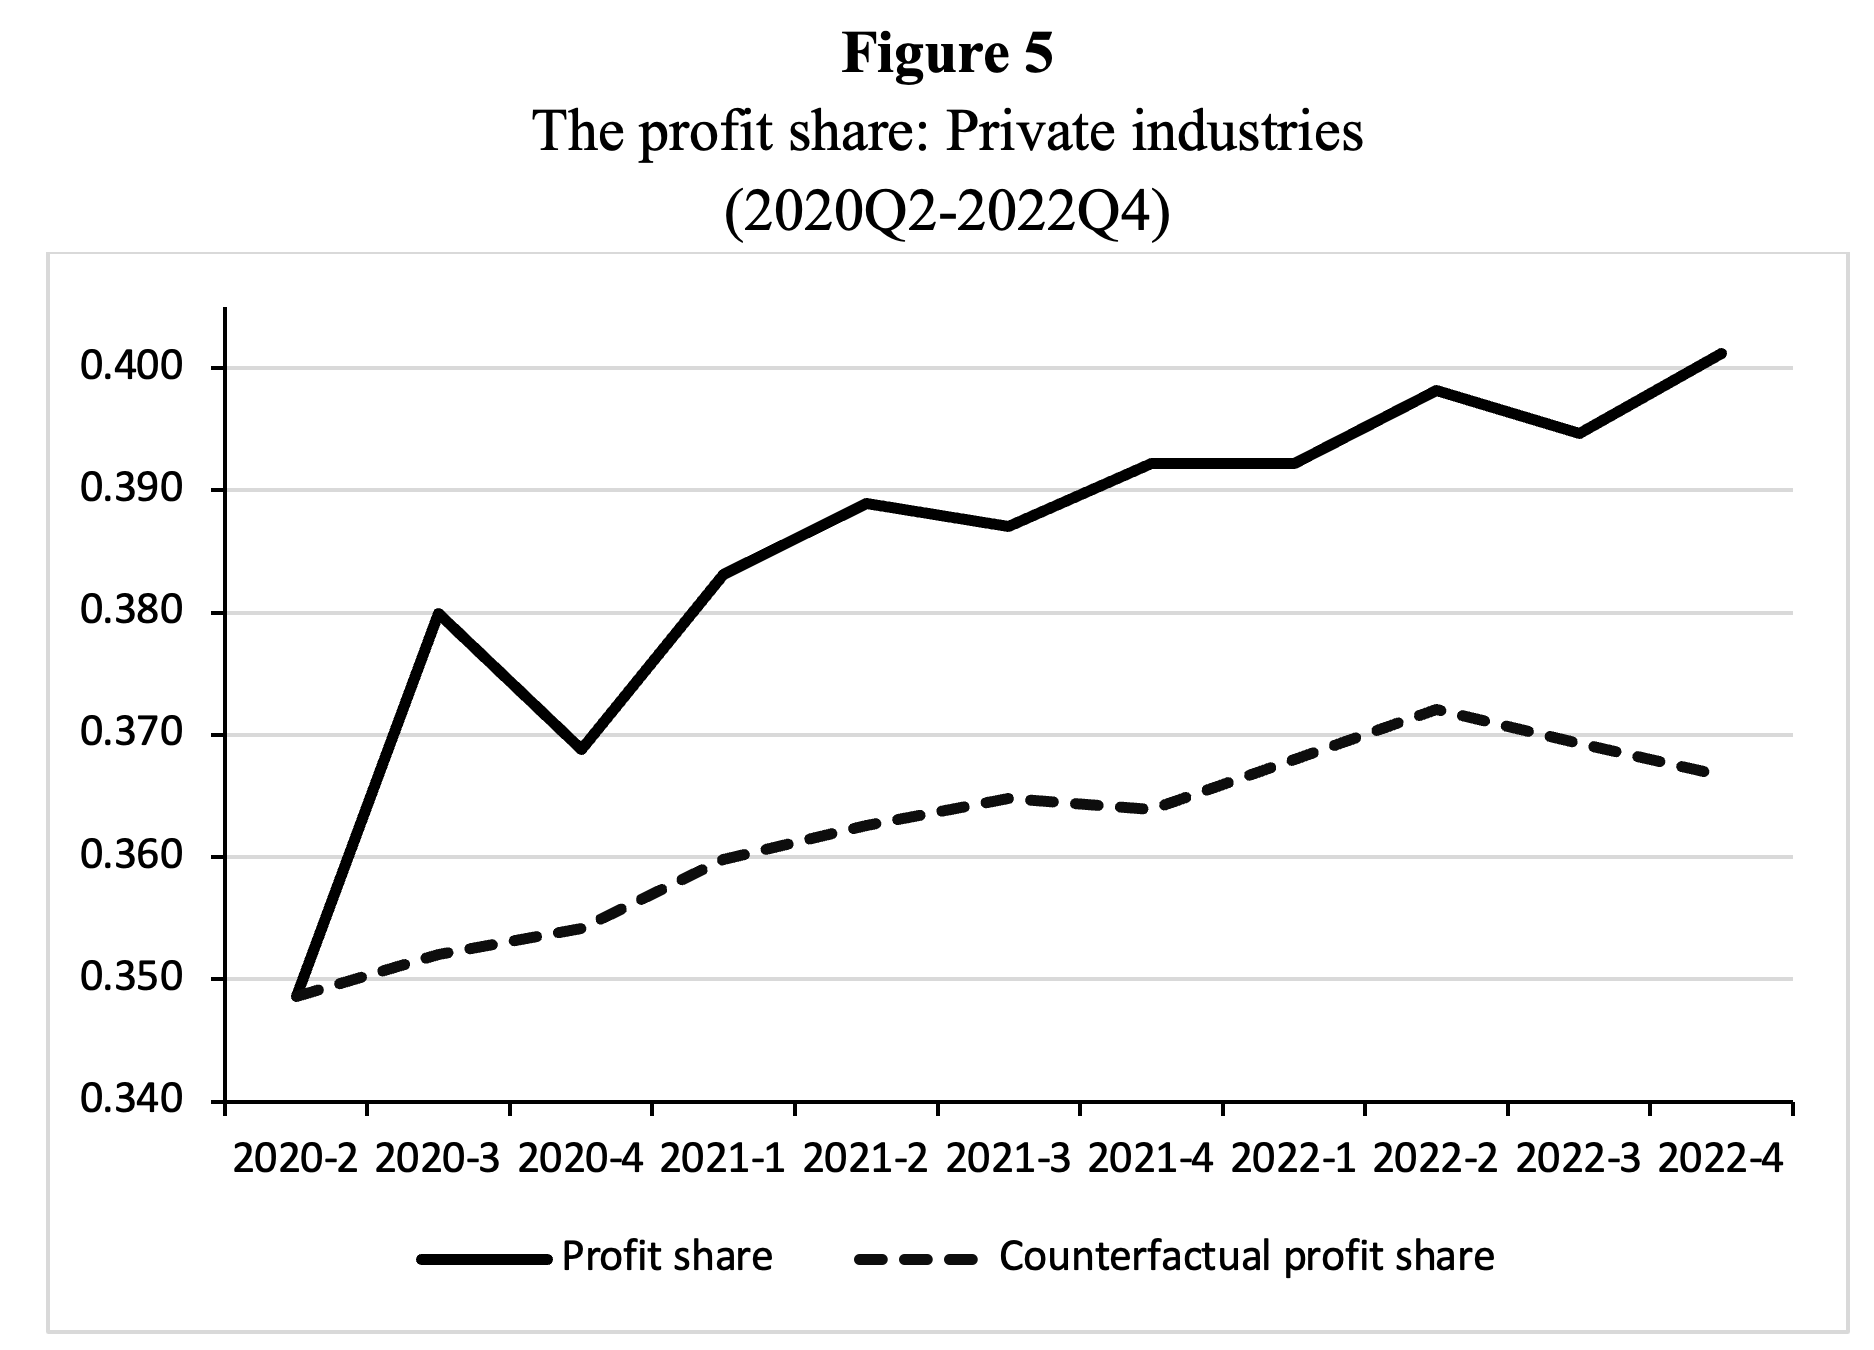
It is also true that the average profit share of private industries has increased—from 0.349 in 2020Q2 to 0.401 in 2022Q4 (see Figure 5). But a considerable proportion of the increase in the profit share has been caused by the rise in the profit markup. This follows from eq. (2), but Figure 5 illustrates the point as well. I have calculated the counterfactual profit share of private industries, assuming that the profit markup does not increase, but remains equal to 0.247 (its value in 2020Q2). The counterfactual profit share rises by just 5.2% or just one-third of the actual profit share increase (by 15.7%) during 2020Q2-2022Q4. Two-thirds of the U.S. profit share growth reported in Table 1 can thus be attributed to corporate profiteering.
This shows that recent profit share growth has been overwhelmingly driven by the growth in the profit markup. Profit inflation is not just a temporary fad—at least, in the U.S.
Source: Author’s estimates. Calculated using data from the National Income and Product Accounts (NIPA) of BEA.
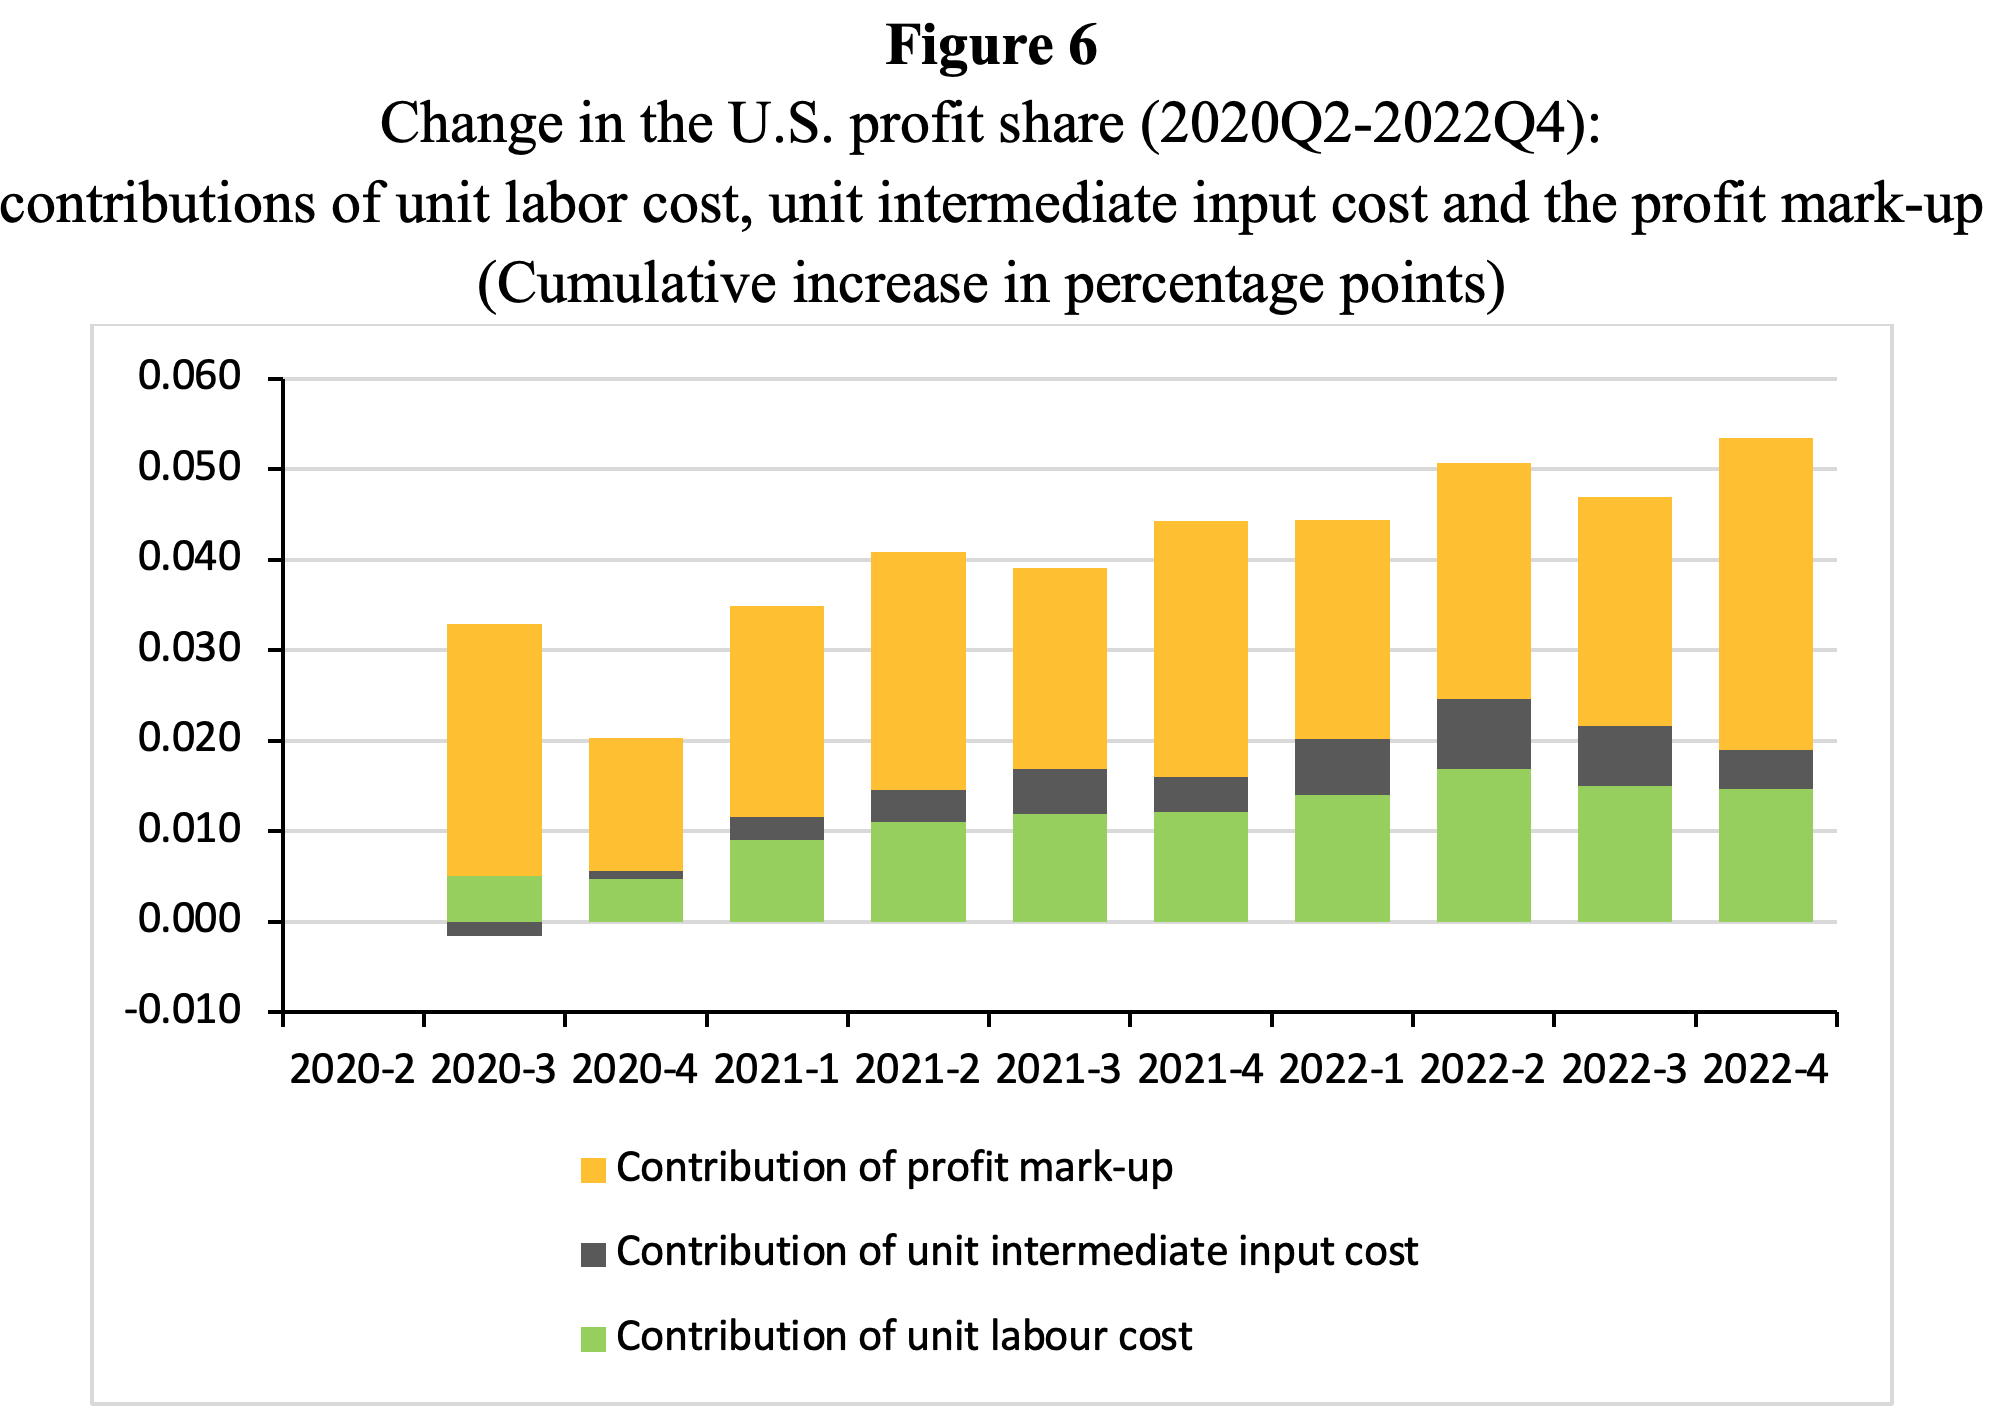
We can also now empirically address the point made by Lavoie: to what extent is the rise in the profit share driven by the increase in the price of intermediates (energy)? The answer can be read in Figure 6 which decomposes the profit share into (a) a contribution by unit labor cost; (b) a contribution by unit intermediate input cost; and (c) a contribution due to a higher markup τ.
It can be seen that rising prices of intermediate inputs (energy) explain only a small proportion (of circa ten percent) of the rise in the average U.S. profit share. Higher unit labor costs are responsible for around 25% of the increase in the profit share during 2020-22. The increase in the profit markup by U.S. firms explains the remaining (almost) two-thirds of U.S. profit share growth during 2020-2022 (as was already clear from Figure 5).
It is impossible, in other words, to explain the growth of the U.S. profit share in recent times while ignoring the steady increase in the (average) profit markup—big corporations have clearly taken advantage of the current generalized inflationary moment.
Source: Author’s estimates. Calculated using data from the National Income and Product Accounts (NIPA) of BEA.
Source: Author’s estimates. Calculated using data from the National Income and Product Accounts (NIPA) of BEA.
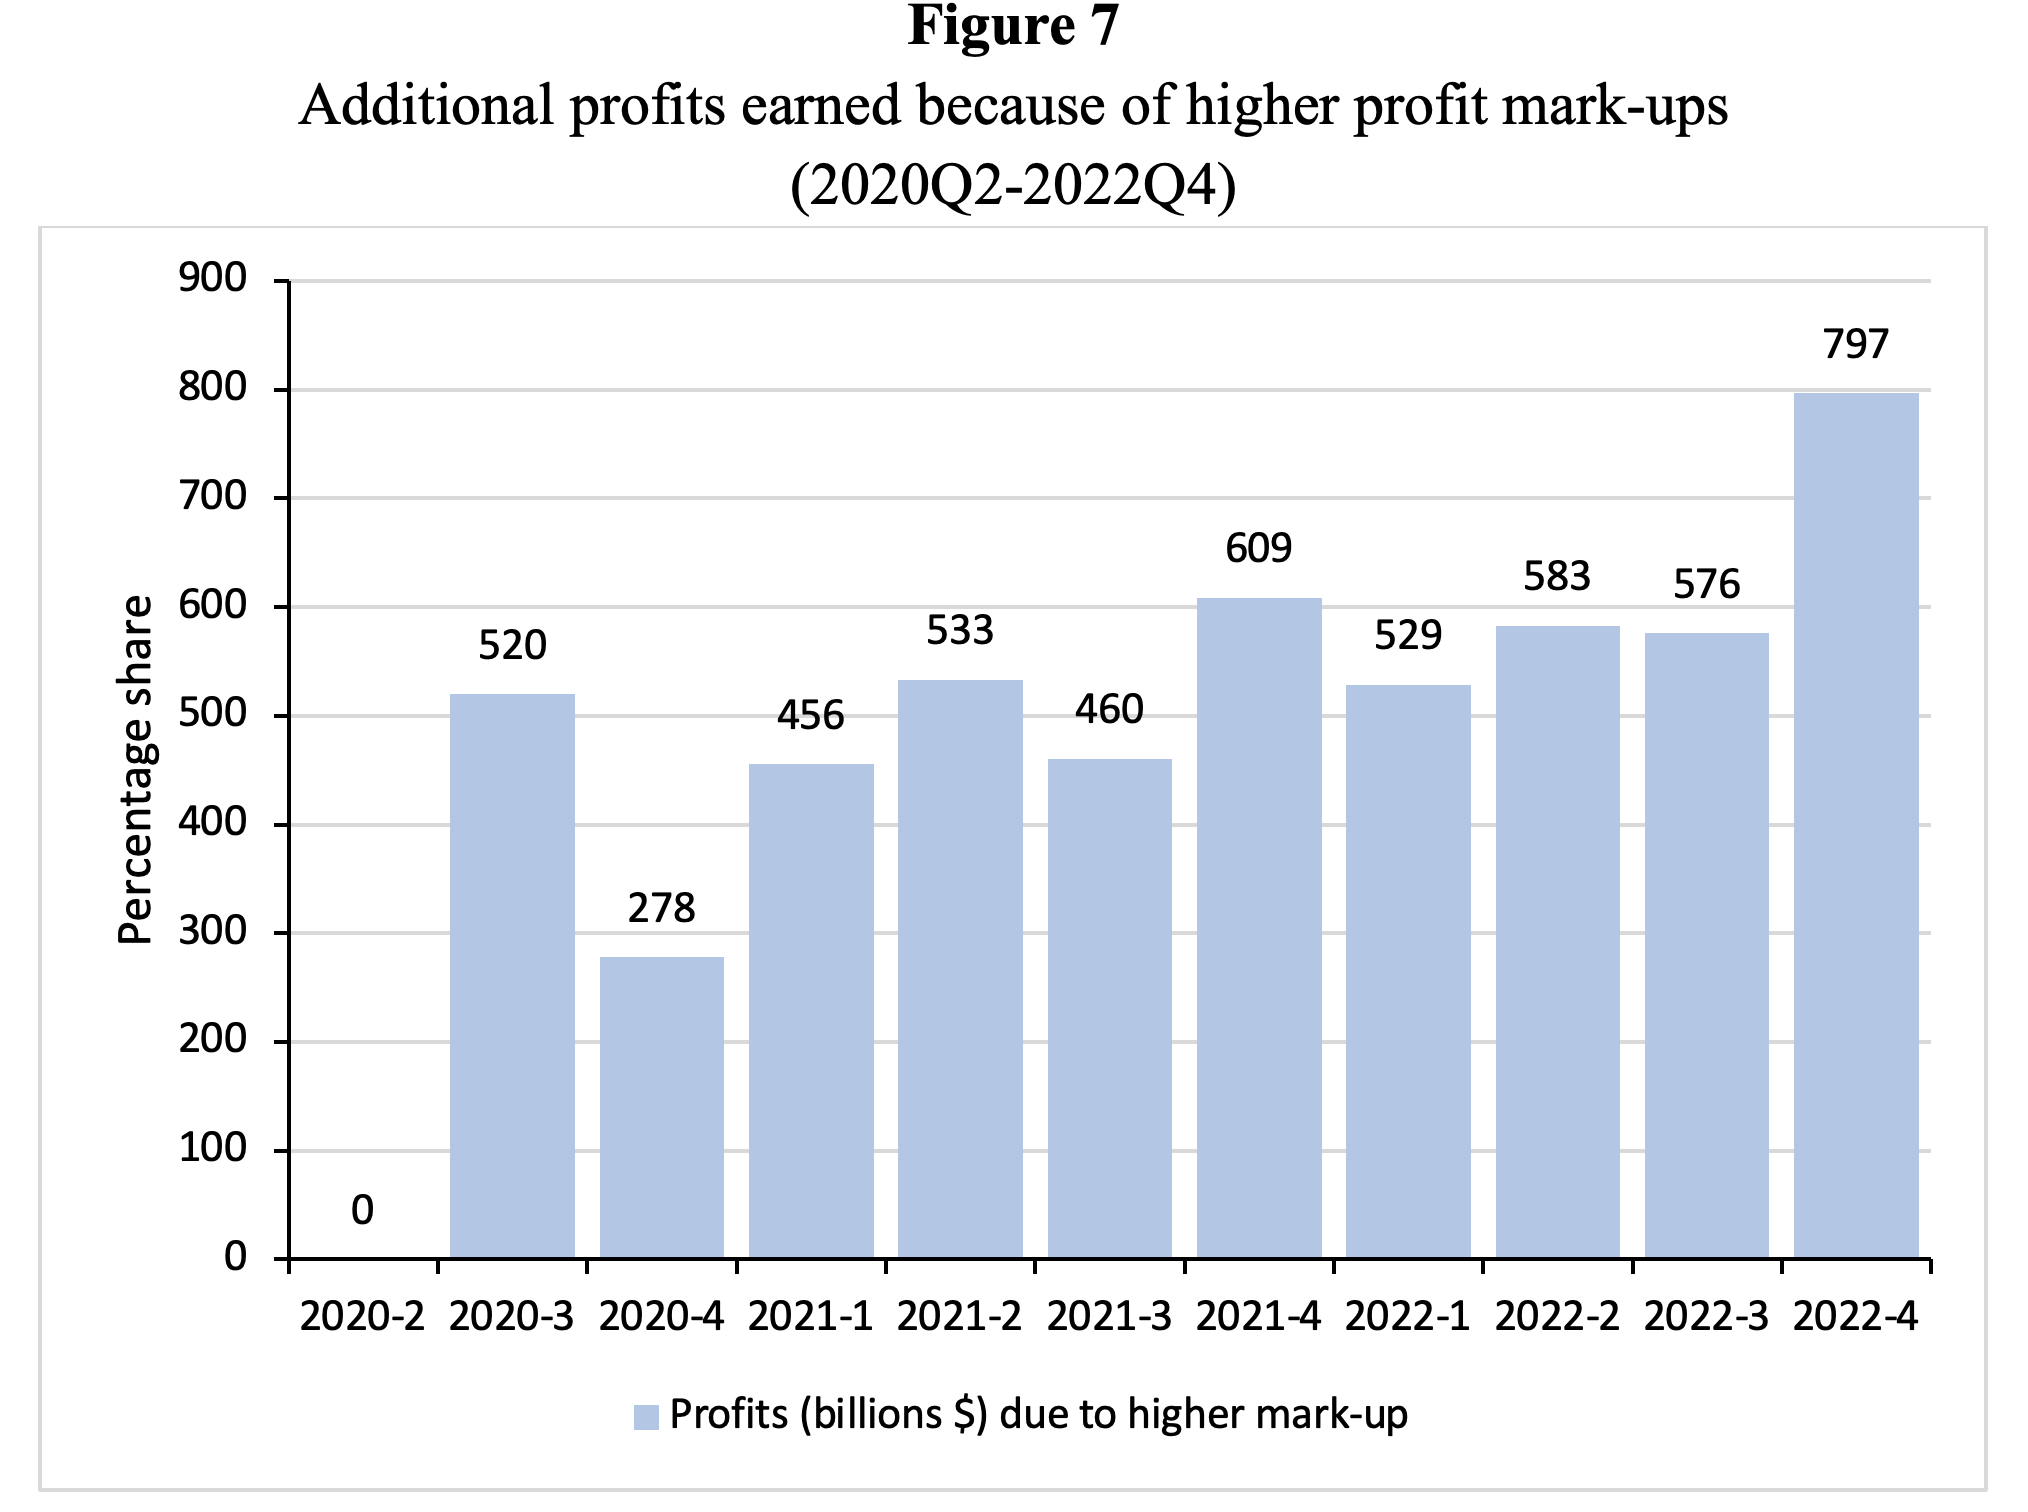
I have calculated the absolute increase in nominal profits of private industries that can be attributed to the sustained increase in the profit markup (see Figure 7). On average, during 2020Q2-2022Q4, (large) corporations harvested more than $0.5 trillion per quarter in additional nominal profits by using their (already existing) market power, “pushing prices higher than just the cost push”, in Lagarde’s not-to-be-misunderstood words. These profiteering profits made up around 6.5% of realized profits in the U.S. during these two years.
Under the motto, “never let a crisis go to waste”, large corporations, across many industries, used the occasion to raise markups and profits to the ultimate benefit of their shareholders and at huge costs for the rest of society, because “they could do it”. Essentially what has happened and is still happening is that dominant firms have been using the inflationary environment as an excuse to raise prices more than necessary, because they do know that their competitors will do the same—rather than forcing them to keep prices down. As Wall Street Journal author Jon Sindreu (2023) notes, “Companies, which in normal times are wary of angering customers with big price changes, seem to have seized on the excuse of generalized inflation to shield their margins.” Not just shield, but increase their margins—as we just saw.
In the inflationary environment, everybody knows that prices are increasing—and hence, the inflationary context offers an opportunity for large firms to push up their prices as much as they can. From the outside, this market behavior almost looks like a cartel. And the result is cartel-like: high levels of corporate concentration allow Big Firms to operate on the tacit understanding that they can raise profit mark-ups without punishment. The corporate motto in concentrated markets resembles the maxim of the Three Musketeers: “All for One and One for All.”
More (international) empirical evidence on profit inflation
The debate on profit inflation is hindered by the fact that the data needed to estimate the impact of changes in unit profits on the gross output price and the Consumer Price Index are not generally available directly. ECB president Lagarde, while admitting that the contribution of rising profit mark-ups to inflation “had gone a little bit missing,” laments a lack of data. “We don’t have as much or as good data on profit as we do on wages,” she said, adding, “If I had the choice, I would improve our data on profits on an aggregate basis as well as on a more granular basis.”
While this is certainly true, there is good recent research on profit mark-ups that— quite unambiguously—shows that the average profit markup of U.S. corporations has risen in recent times. For example, recent evidence of rising profit mark-ups in the U.S. presented by Michalis Nikiforos and Simon Grothe (2023) (published on the INET website, here), Federal Reserve economists Andrew Glover, José Mustre-del-Río and Alice von Ende-Becker (2023) and Mike Konczal and Niko Lusiani (2022). Glover et al. (2023) conclude that rising mark-ups “could account for more than half of 2021 inflation” in the U.S.
Banca d’Italia economists Colonna, Torrini and Viviano (2023) estimate average profit mark-ups for key U.S. industries. Because BEA industry-wise data on the ratio of gross operating surplus to the value of gross output are available only up to 2021Q1, they instead use ‘gross corporate profits’ (as a ratio of gross output). This is reasonable because corporate profits are the major component of gross operating surplus, which in addition includes consumption of fixed capital, net taxes on production and imports, net business current transfer payments and net interest and miscellaneous payments. Corporate profits and gross operating surplus are very closely correlated (r=0.96;t-value=47.3;n=213; period of analysis 1970Q1-2023Q1) and, hence, corporate profits do provide a good approximation of profit dynamics.
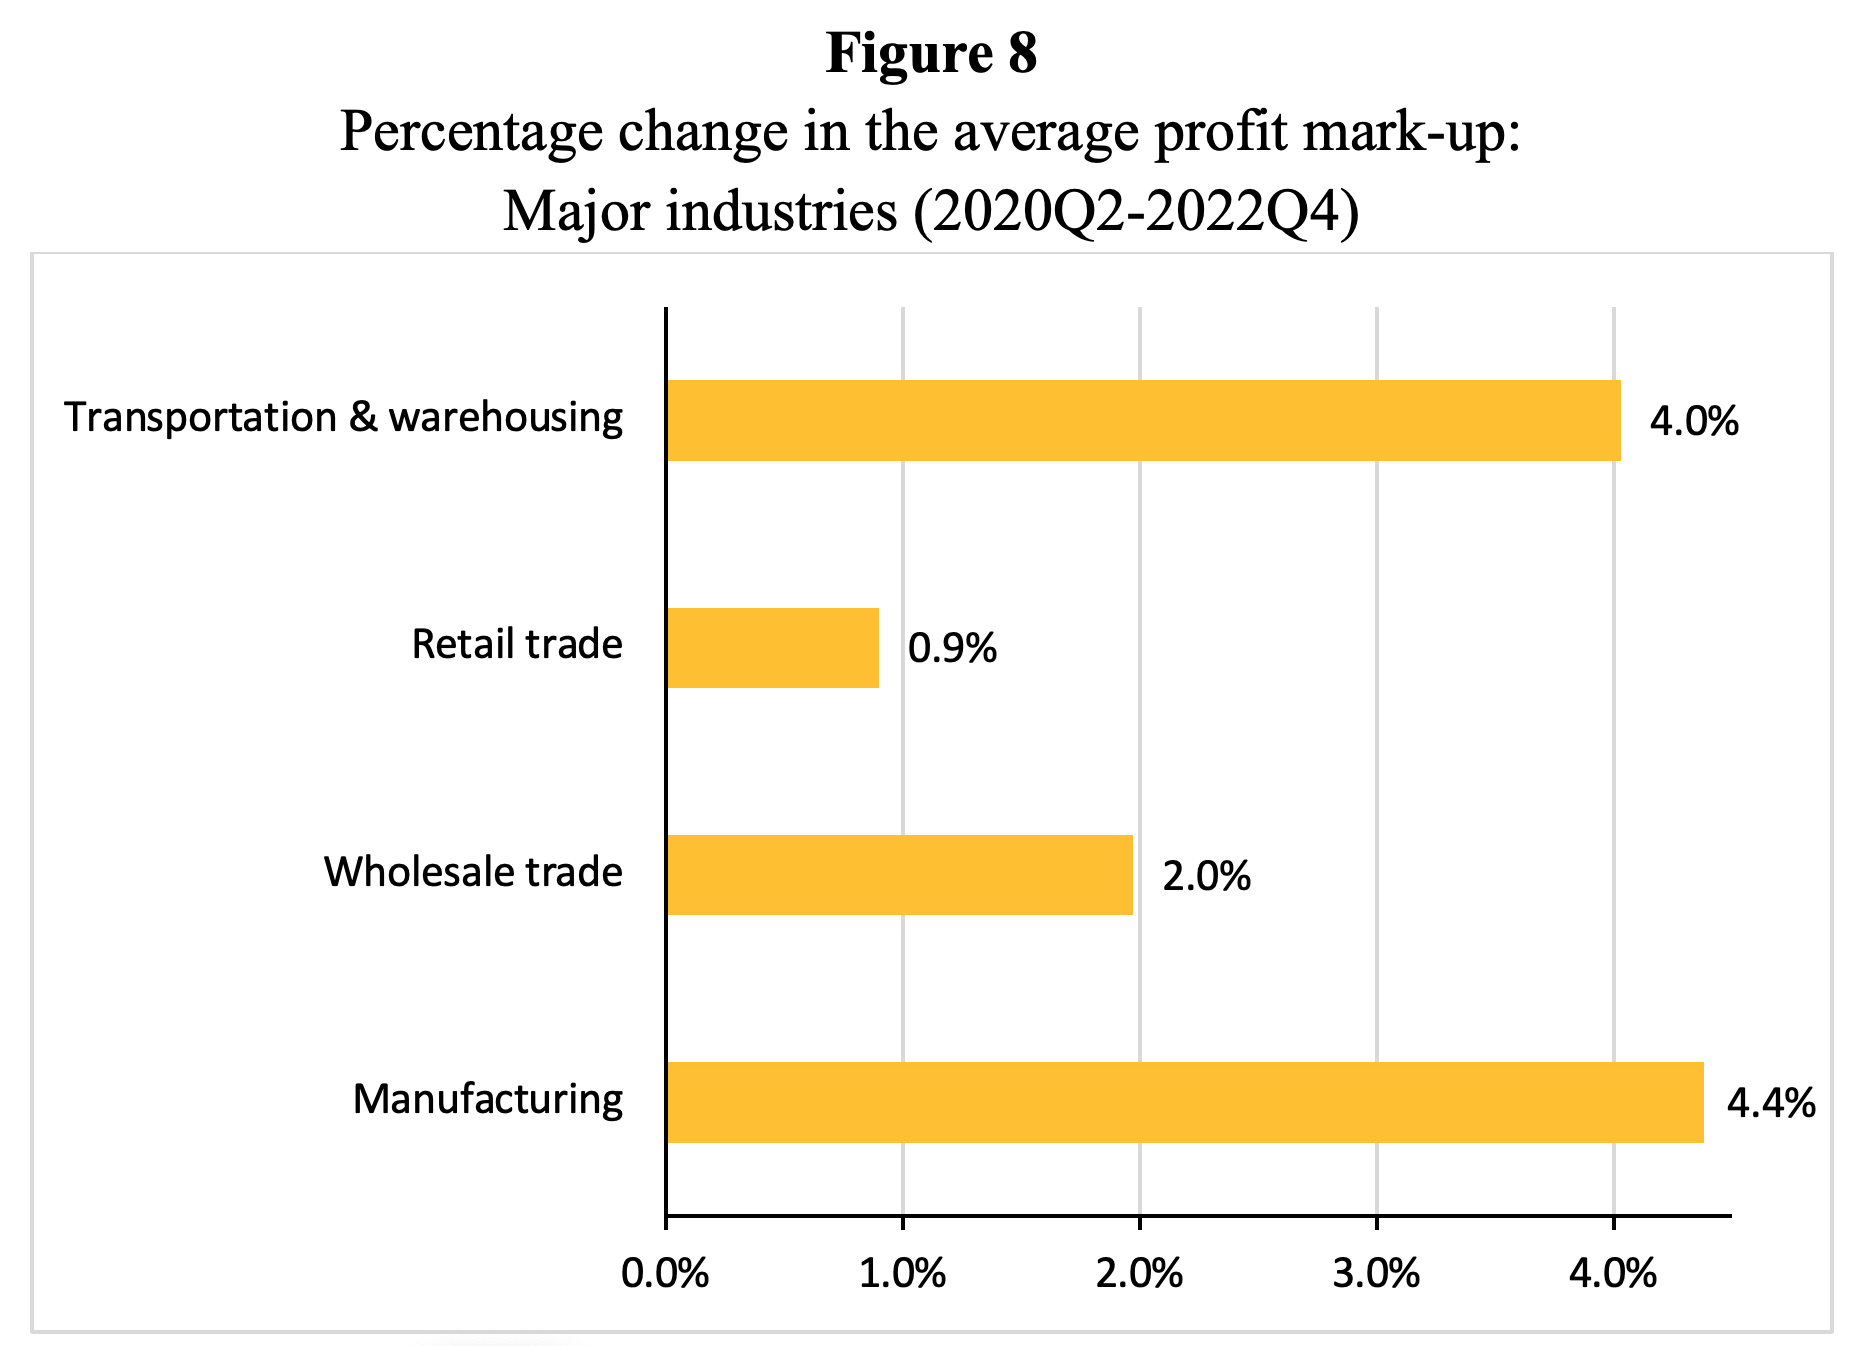
I have calculated the quarterly profit mark-ups by major industry during 2020Q2-2022Q4—Figure 8 presents the percentage increase in the average (industry-wise) profit markup for manufacturing, retail trade, wholesale trade, and transportation & warehousing. These estimates confirm that (average) profit markups have indeed increased in the U.S.
Source: Author’s estimates following Colonna et al. (2023). Calculated using data from the National Income and Product Accounts (NIPA) of BEA.
Of course, the increase in average mark-ups by industry does not mean that all firms in those industries have been able to raise their profit margins. Medium- and small-scale businesses mostly struggle to protect their profit margins in the face of especially higher intermediate (energy) input costs. However, bigger corporations with sufficient market power have succeeded in not just shielding their profits from the drastic increase in production costs, but even in raising their mark-ups. Service-sector corporations including major online retailers and retail gasoline firms, have managed to do so, often by adopting high-speed algorithmic pricing strategies to profit from customers who are more willing to pay more for their services.
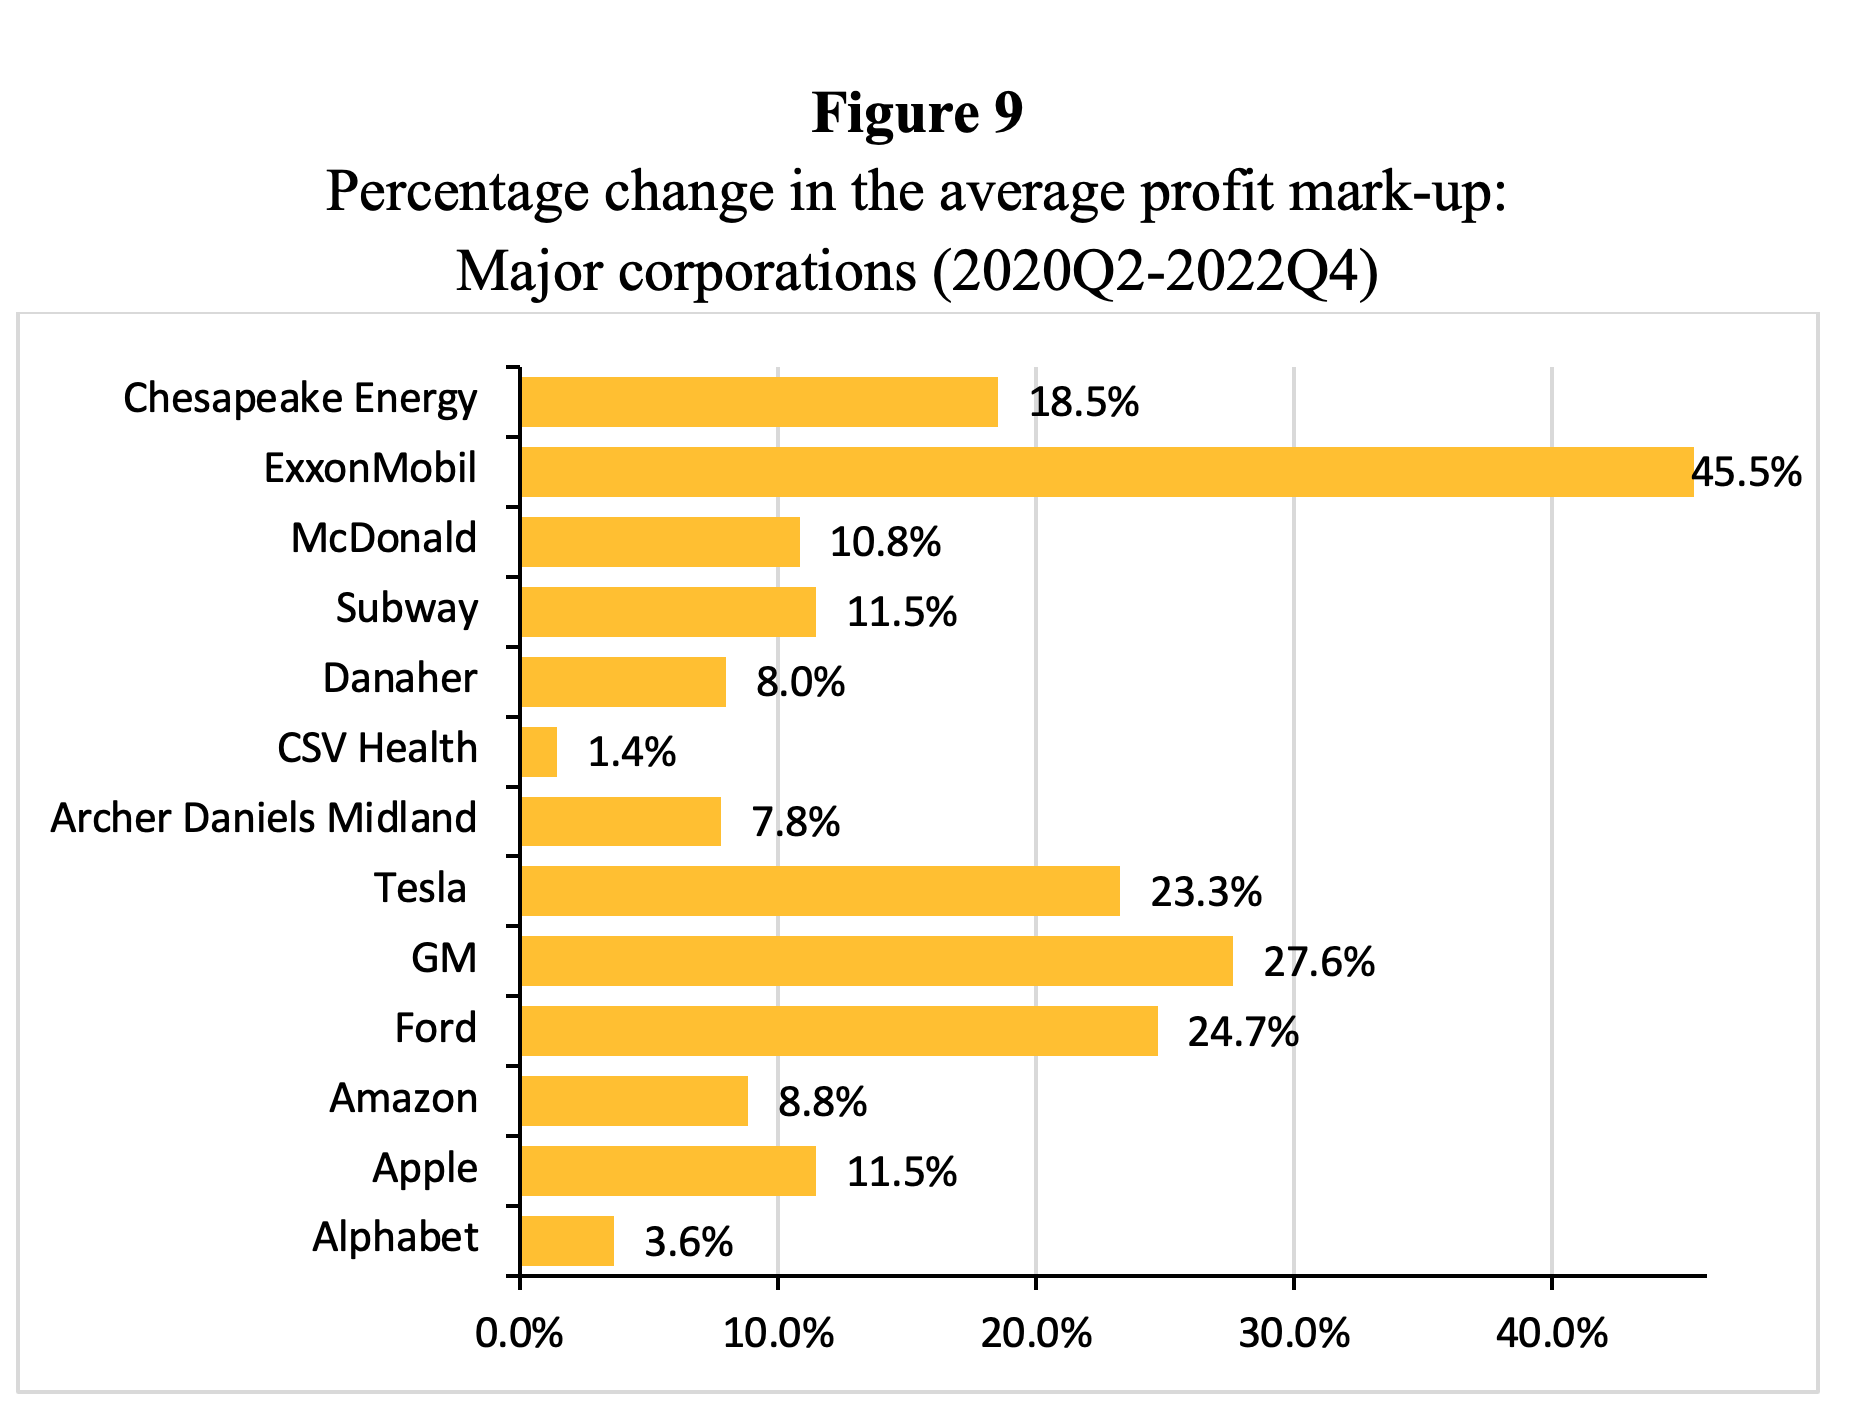
Figure 9 offers evidence on the change in gross profit margins of a few major non-financial corporations in the U.S. during 2020Q2-2022Q4 which suggests that these oligopolists have indeed succeeded in “pushing prices higher than just the cost push”—as ECB President Lagarde puts it so clearly.
Not surprisingly, oil major ExxonMobil leads the pack, having been able to raise the markup by more than 45%. “What we are seeing today is a naked exercise of oil producers’ market power,” writes Joseph Stiglitz (2022) fittingly. But the automotive industry (Ford Motor Company, GM, and Tesla) has not fared badly as well, with mark-ups up of around 25%. Retail food chains McDonald’s and Subway managed to push up margins by more than 10% (over rising production costs), with tech giants Amazon and Apple doing more or less the same. It should be clear from Figure 9 that the increases in mark-ups are not only in energy but dominant firms in retail, wholesale, online services and manufacturing are having a bonanza as well.
Source: Author’s estimates, calculated using data on gross margins from https://www.macrotrends.net
Finally, I would like to highlight a recent analysis for the Netherlands (my own country) by researchers of Rabobank—the fiftieth largest global bank operating assets worth $730 billion, which is not generally known for its anti-corporate proclivities. The Rabobank report, written by Hugo Erken and Stefan Groot (2023) and published on May 5, has led to an ongoing intense public debate in the Polder, because it provides clear evidence in support of profit inflation in the Dutch economy during 2021Q4 and 2022Q4. Erken and Groot (2023) decompose the increase in aggregate quarterly Dutch profits during 2021Q4 and 2022Q4 into separate contributions by (a) an increase in the gross output price; (b) an increase in the volume of gross output; (c) an increase in wage costs; and (d) an increase in the cost of intermediate inputs. To do so, they first define total profits Π as being equal to the value of gross output minus wage costs and the cost of intermediate inputs, or
(8) Π=p x- β wx+ α ρM x
The increase in total (nominal) profits can then be decomposed as follows:
(9) ΔΠ=(p1-p0 )x1+(x1-x0 )p0-(β1 w1 x1-β0 w0 x0 )-(α1 pM1 x1-α0 pM0 x0 )
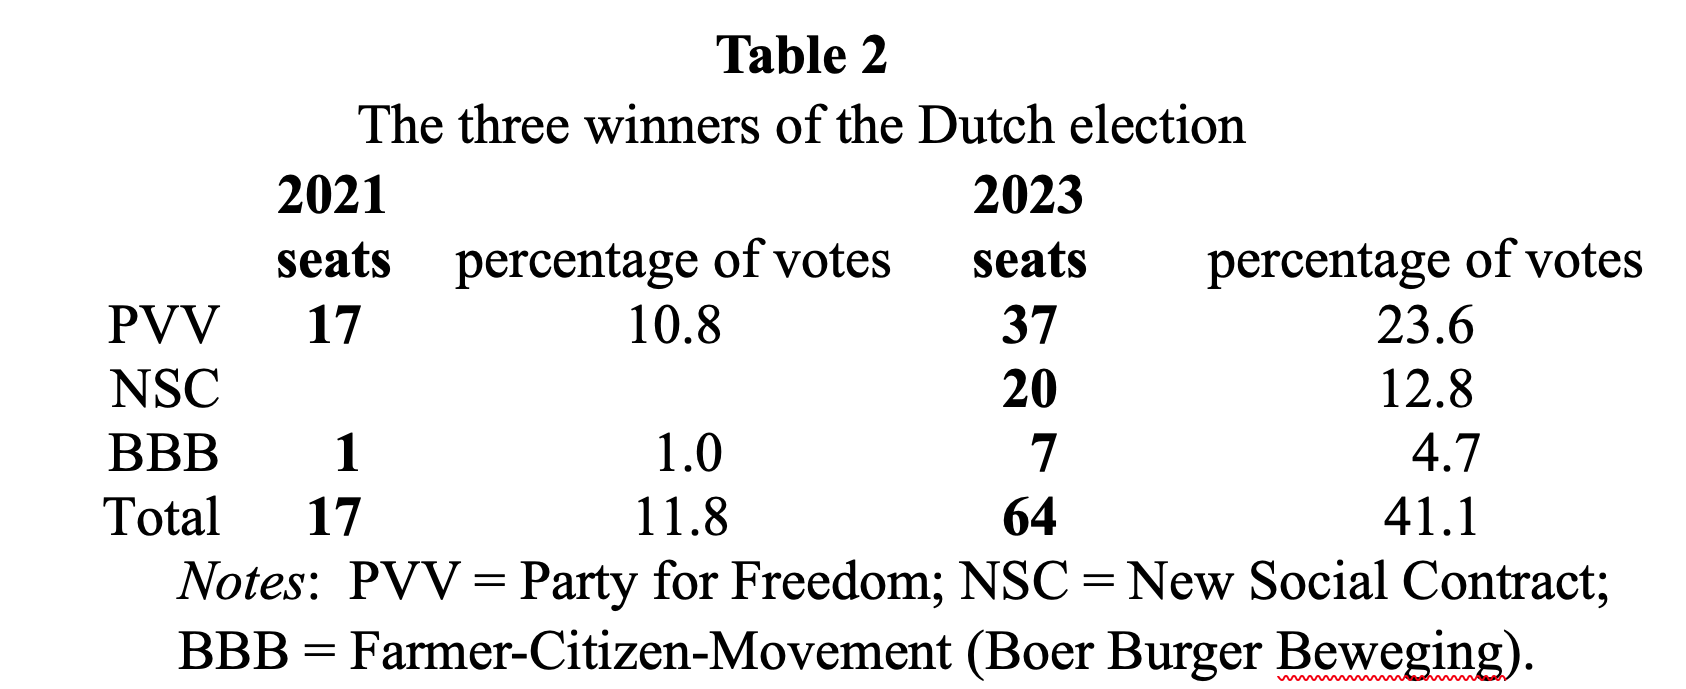
The results of this decomposition exercise are shown in Table 2. It is evident that the increase in Dutch profits during 2022 is primarily caused by the increase in the gross output price. The gross output price increased partly because wage cost and intermediate input cost increased, and partly due to an increase in the profit markup of Dutch firms. In fact, the increase in the markup explains more than 26% of the increase in the gross output price.[1]
According to Erken and Groot (2023), the increase in the average markup raised the Dutch general price level by 2.2 percent points during 2022 and this explains almost one-fifth of the Dutch inflation rate during 2021Q4-2022Q4.
Source: Based on Erken and Groot (2023).
By way of conclusion
The recent intervention in the controversies on profit inflation by Marc Lavoie provides a useful conceptual correction to a widely used measurement of ‘profit inflation’—the increase in the aggregate profit share—which upon closer examination does not tell us anything about what has happened to the profit mark-up. As Lavoie is rightly arguing, the profit share may increase in times of rising prices of energy and materials, even if firms do not take advantage of the “uncertainty created by high and volatile inflation” by raising their markups.
However, Lavoie is wrong when suggesting, as a more or less universal stylized fact, that “the rise in profits and the profit share can be explained without resorting to an explanation based on firms taking advantage of the situation and raising markup rates.” In principle, profit share inflation could also be due to increases in the profit markup—and the empirical evidence for the U.S. shows that the increase in the American profit share is overwhelmingly caused by a steady increase in the markup. For the U.S., the Netherlands, and also other Eurozone economies, the rise in profit mark-ups has been the main driver of (gross output price) inflation. Higher prices of intermediate (energy) inputs have certainly added to the inflationary pressure (while at the same time, raising the profit share). Of course, these outcomes reflect conflict inflation—but today (unlike during the 1970s), the outcome is not a wage-price spiral but a profit mark-up-price spiral. Lane is completely right when concluding that “wages had had only a limited influence on inflation over the past two years.”
The evidence on profit inflation was first ignored and then denied— ‘serious’ economists were laughing at and then attacking those proposing that higher mark-ups were a major driver of inflation. However, their attitude has changed now that the evidence has become so solid that denial of profit inflation is no longer plausible. Illustrating this new attempt to neutralize the debate on corporate profiteering, Jon Sindreu, writing in the Wall Street Journal of May 25, 2023, argues that “’Greedflation’ is real—and probably good for the economy.” His point appears to be that corporations have been able to hike their profit mark-ups only because customers have kept spending money; seen this way, the higher profit markup and higher inflation are to be blamed on an excess of aggregate demand.
Blaming excess demand is grist to the mill of conservative and libertarian economists who, following Milton Friedman, have the particular habit of blaming every problem on the state and fiscal profligacy, especially when the incumbent administration is a Democratic one. To illustrate the point: economists of the Cato Institute (Lincicome 2023) reject the diagnosis of profit inflation, arguing that American consumers, rich in cash because of Biden’s supposedly ‘all-too-generous’ pandemic income relief checks, have created a surge in (nominal) demand growth, and during this ‘consumption boom’, it was completely ‘natural’ for corporations to increase their profit margins (mind you, they’re not talking about mark-ups). Corporations are not charities and because of their obligation to maximize value for their shareholders, they have to reap whatever windfall profits they can get.
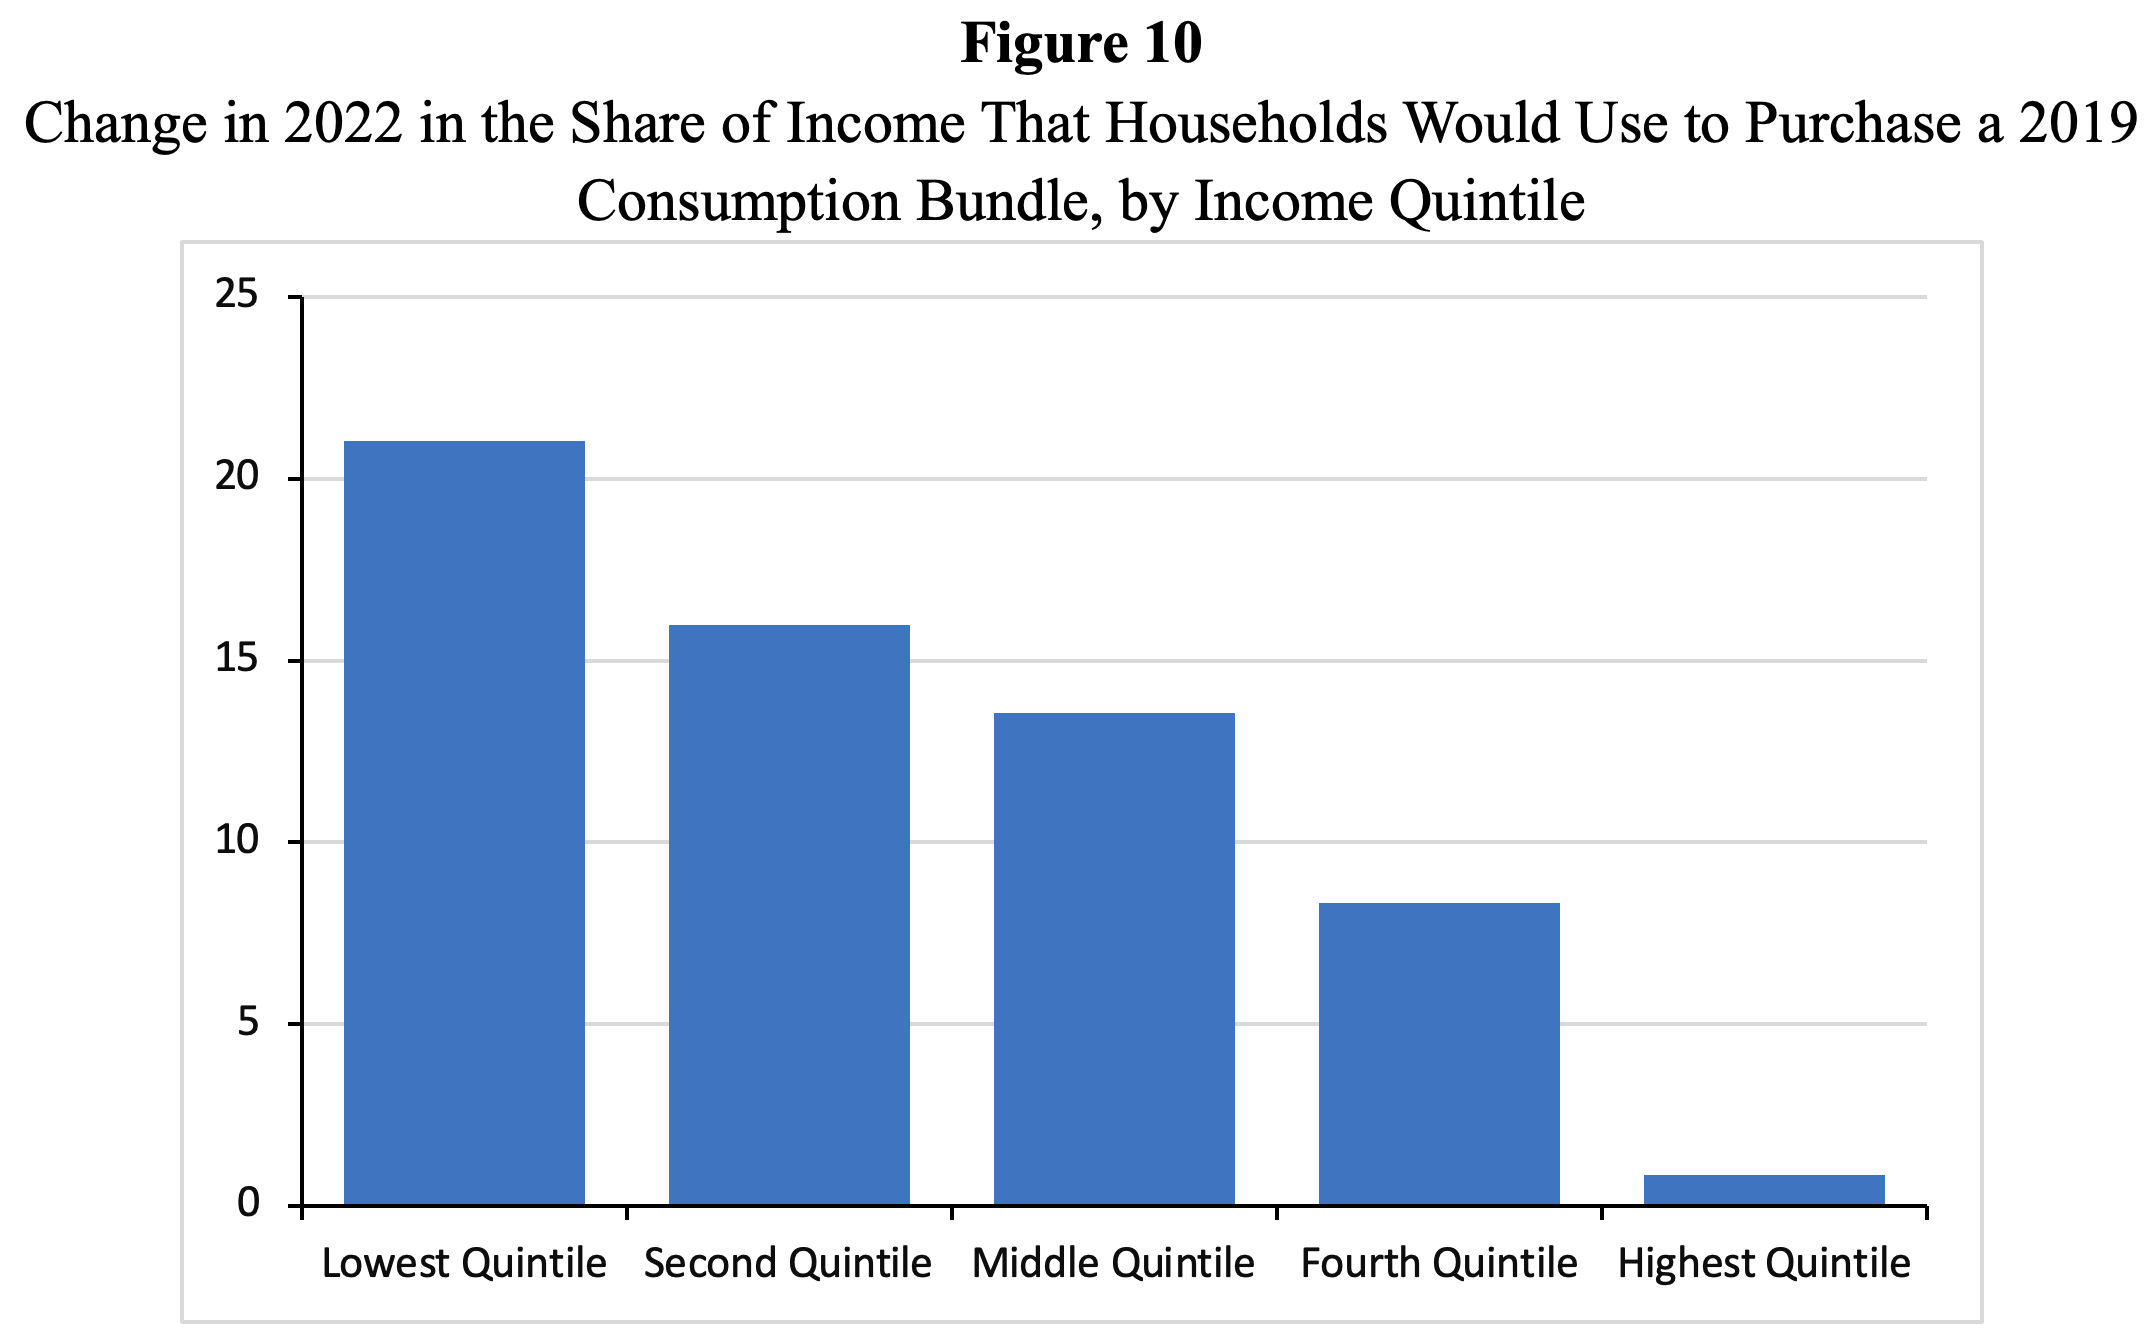
This particular argument focused on an excess demand does not hold water, however, because it ignores the negative effect of higher prices on real incomes for the large majority of U.S. households. To make the point, we can use data from the Congressional Budget Office (2022) which shows how different U.S. households are affected differently by the rise in inflation. CBO held quantities of consumption constant by considering an average bundle of goods and services purchased in that year by households in each quintile of the income distribution.[2] The results are shown in Figure 10.
Source: Congressional Budget Office (2022).
It is evident that inflation forced U.S. households to spend much larger shares of their incomes on consumption in 2022 than in 2019 if they wished to buy the same consumption bundle as they had bought in 2019. The share of consumption in the income of households in the lowest income quintile would have had to rise by 21% to make up for the elevated prices of the unchanged consumption bundle, while households in the second and third quintiles would have needed to increase 16% and 13.6%, respectively, of their incomes just to maintain their consumption levels at the level of 2019.
In other words, consumption demand of the poorest 80% of U.S. households did not and could not increase a lot—and clearly did not cause an excess of aggregate demand and cannot, therefore, be blamed for causing ‘profit inflation’. What happened instead, as has been documented by Ferguson and Storm (2023), is that aggregate demand in the U.S. economy did increase, thanks to unprecedented gains in household wealth during 2020-22, particularly for the richest 10% of US households. Wall Street Journal’s Jon Sindreu may well be right in arguing that moderately elevated demand allowed price-setting corporations to raise their mark-ups—but, as explained by Ferguson and Storm (2023), this price gauging is, without doubt, bad for the U.S. economy. I conclude by concurring with ECB President Lagarde that “it’s important that competition authorities could actually look at those [price gauging] behaviors, and I would certainly regard that as perfectly called for.”
References
Allenbach-Ammann, J. 2023. “ECB-Lagarde says corporate profits contributed to inflation.” Euractiv, June 6.
Arce, O., E. Hahn and G. Koester. 2023. “How tit-for-tat inflation can make everyone poorer.” The ECB Blog, March 30.
Bivens, J. 2022. “Corporate Profits Have Contributed Disproportionately to Inflation. How Should Policymakers Respond?” Working Economics Blog.
Capolongo, A., M. Kühl and V. Skovorodov. 2023. “Firms’ profits: cure or curse?” The ESM Blog, May 12. European Stability Mechanism.
Colonna, F., R. Torrini and E. Viviano. 2023. “The Profit Share and Firm Mark-up: How to Interpret Them?”, Occasional Papers, Banca d’Italia, No. 770.
Congressional Budget Office. 2022. “How Inflation Has Affected Households at Different Income Levels Since 2019.”
Erken, H. and S. Groot. 2023. “Is in Nederland sprake van ‘graaiflatie’?” Rabobank Research, May 5.
Ferguson, T. and S. Storm. 2023. “Myth and Reality in the Great Inflation Debate: Supply Shocks and Wealth Effects in a Multipolar World Economy.” International Journal of Political Economy 52 (1): 1-44.
Glover, A., J. Mustre-del-Río and A. von Ende-Becker. 2023. “How Much Have Record Corporate Profits Contributed to Recent Inflation?” Economic Review, January 12, Federal Reserve Bank of Kansas City.
Konczal, M. and N. Lusiani. 2022. “Prices, Profits, and Power: An Analysis of 2021 Firm-Level Markups.” Roosevelt Institute Brief, June 21.
Lavoie, M. 2023. “Some controversies in the causes of post-pandemic inflation”, Monetary Policy Institute blog #77, May 14, 2023.
Lincicome, S. 2023. “Three Big Strikes against ‘Greedflation’”. Commentary, Cato Institute.
Nikiforos, M. and S. Grothe. 2023. “Markups, Profit Shares, and Cost-Push-Profit-Led Inflation.” Article for the Institute for New Economic Thinking, June 6.
OECD. 2023. Economic Outlook June 2023. Paris: OECD.
Partington, R. and G. Waerden. 2023. “European Central Bank chief suggests firms are engaging in ‘greedflation’.” The Guardian, May 4.
Perkins, T. 2022. “Revealed: top US corporations raising prices on Americans even as profits surge.” The Guardian, April 27.
Randow, J. and A. Eglitis. 2023. “‘Greedflation’ is the European Central Bank’s latest headache amid fears it’s the key culprit for price hikes.” Fortune, April 27.
Sindreu, J. 2023. “‘Greedflation’ Is Real—and Probably Good for the Economy.” Wall Street Journal, May 25.
Stiglitz, J.E. 2022. “A balanced response to inflation.” Project Syndicate, February 7.
Storm, S. 2022. “Inflation in a Time of Corona and War.” INET Working Paper No. 185. New York: Institute for New Economic Thinking.
Notes
[1] This has been calculated by dividing the contribution of a higher markup to gross profits (25.0%) by the contribution of a higher gross output price to profits (98.1%).
[2] The cost of health care benefits that people receive from the government or their employer were removed from the analysis, because CBO does not have comparable data about prices, quantities, or subsidies for such benefits.
For a PDF version of this article, click here
Marc Lavoie's response to Storm: Profit Inflation and Markups Once Again