
During the UK election campaign, all opposition parties strongly appealed to young people to register to vote and participate in the election. The ruling Conservative party, which usually cashes in majorly on the grey vote never participated in campaigns to encourage voter participation. In some sense, the Conservative party has thrived on the voluntary disenfranchisement of the young. Was the 2017 General Election different?
Size of Electorate and recent Turnout Trends
A first look is to study the evolution of turnout over time across the UK’s parliamentary elections (see the first Figure below). Turnout, as measured as the share of the potential electorate that casts a vote has been trending up over time. This increase in turnout does not appear to be dramatically distorted by an increase in the size of the electorate (i.e. the number of individuals who are registered to vote under the UKs mandatory voter registration laws). The preliminary data available suggests that the size of the electorate increased in absolute terms by only approximately 350,648 (or 0.75 percent) from 46.35 million in 2015 to 46.7 million. The size of the electorate in the EU Referendum in 2016 was very near the midpoint of these two figures (around 46.5 million). This suggests that the electorate did not grow dramatically due to increased voter registration, but seems to be following a similar trend.
The key challenge in studying turn-out is that a break-out of the turnout by age is naturally not available. Exit polls can provide an insight into the age-profile of those who turned up to vote, but first results from an IPSOS poll are not expected until next week.
The main take away from a glance at aggregate figures is that there is an overall level increase in turnout. In absolute (preliminary) numbers, turnout increased by 1.4 million voters or around 2.5 percentage points relative to 2015. This suggests that there has been a significant increase in overall turnout. The next section will present some descriptive evidence suggesting where this increase in turnout came from.
Descriptive Evidence
A first descriptive exercise indirectly explores the extent to which turnout varies across constituencies as a function of the age distribution of the population of that constituency. For every constituency, we observe the age distribution of the resident population across five bins as of the 2011 census as a share of the total resident population: those younger than 15, between 15 and 30, between 30 and 45, between 45 and 60 and above 60. The grey vote is typically referred to as the part of the electorate voting above the age of 60.
Since we do not observe actual turnout by age, we can only infer the statistical associations between an age profile and the underlying overall turnout in a constituency – that is we can see whether constituencies with a younger population tend to have, on average, lower or higher turnout in comparison to those constituencies that have an older population.
In 2015 the picture looked as follows (see second Table): places that had, on average, a higher share of people in the younger than 15 years age bin in 2011, saw significantly lower turnout. In particular, places that had a 1% higher share in the resident population in that age cohort saw, on average, a 0.27 percentage points lower turnout. Note that part of this is mechanical as a large share of those aged younger than 15 in 2011 would not have been entitled to vote in 2015. On the other hand, constituencies with a high share of those aged between 45-60 years (as measured in 2011) saw, on average, significantly higher turnout. For that group a, 1% increase in their population share (which mechanically comes at the expense of other groups), sees on average, a 1.35 percentage point higher turnout.
| Age Cohort | Estimated coefficient | Population Share | Implied mean difference | |
| 2015 | Younger 15 | -0.27 | 17.4% | -5% |
| 15 - 30 | 0.33 | 19.6% | 6% | |
| 30-45 | 1.13 | 20.2% | 23% | |
| 45-60 | 1.35 | 19.8% | 27% | |
| > 60 | 0.67 | 23.0% | 15% | |
| 2017 | Younger 15 | 0.04 | 17.4% | 1% |
| 15 - 30 | 0.30 | 19.6% | 6% | |
| 30-45 | 1.43 | 20.2% | 29% | |
| 45-60 | 0.59 | 19.8% | 12% | |
| > 60 | 0.94 | 23.0% | 22% |
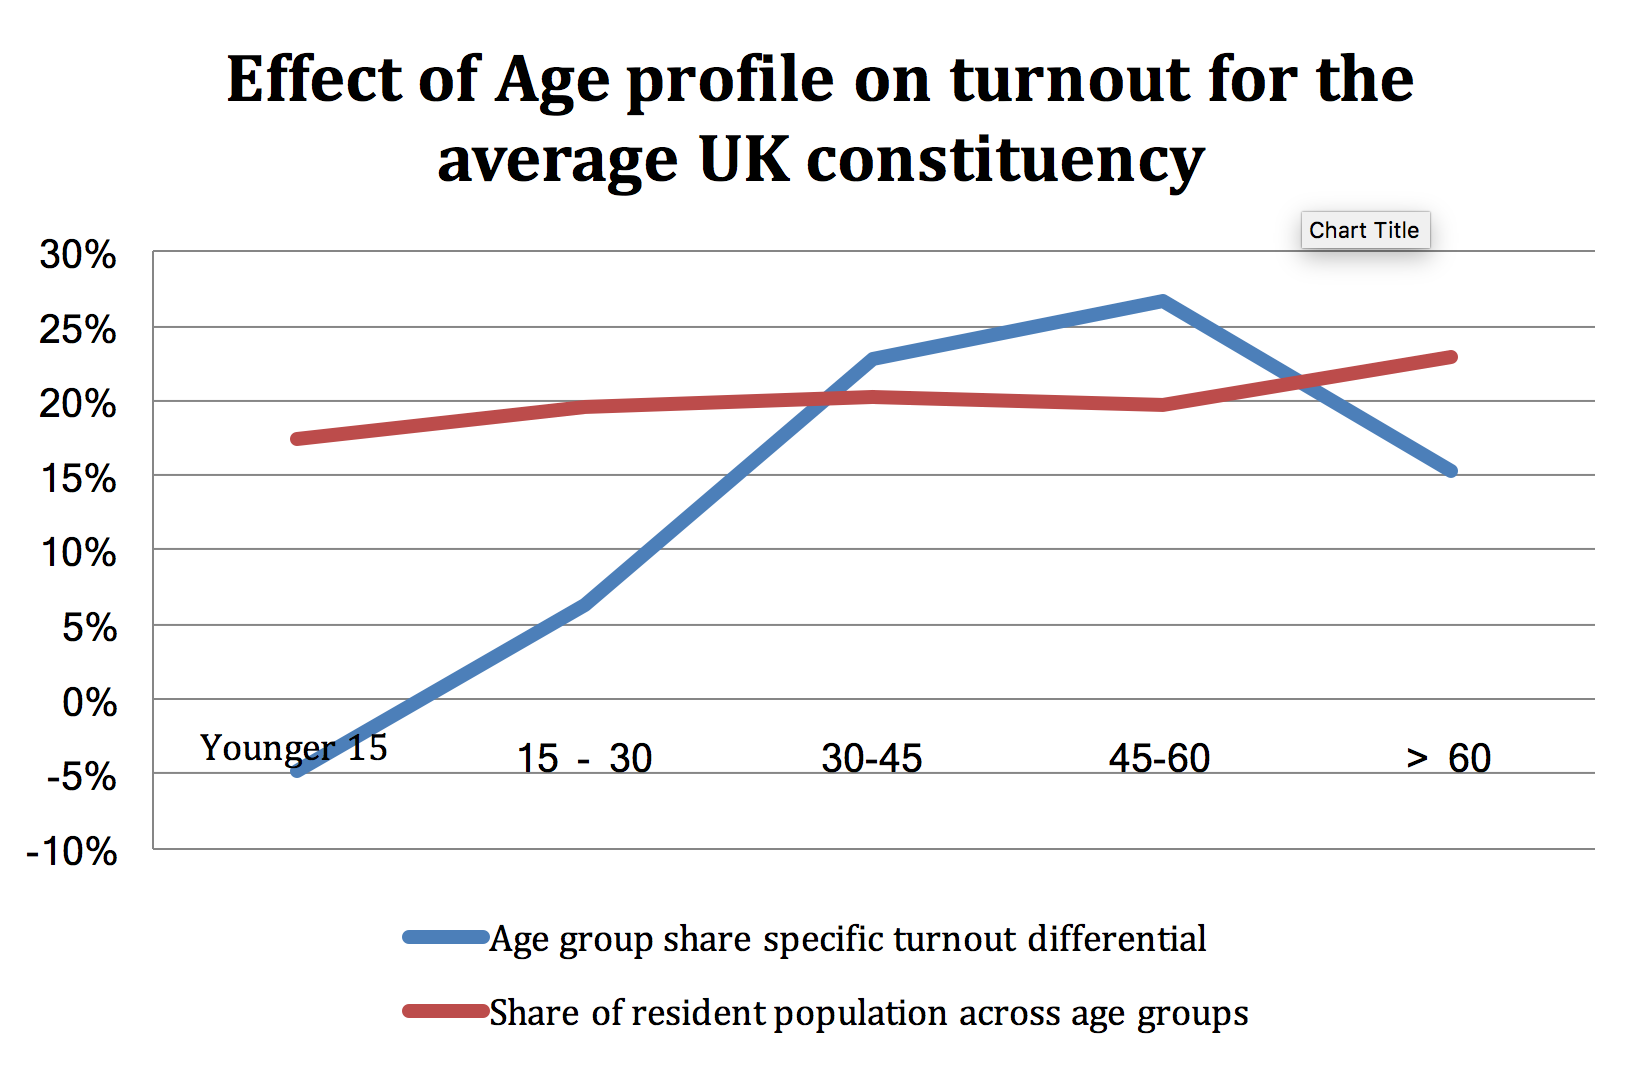
We can compute the relative effect sizes for a representative UK constituency based on the average age distribution of the resident population as of 2011. The results are presented in the third column in the Table and in another figure below.
The figures suggests that a constituency with an average share of residents in the youngest bin as of 2011 would have a 5 percentage points lower turnout. So low turnout in the young demographic is clearly visible. On the other hand, turnout in the older demographic is much more pronounced: constituencies with the UK average share of residents aged between 45-60 as of 2011 (which means they are around 49-64 in 2015), have turnout rates that are dramatically higher: by almost 22 percentage points.
How did this picture change in the 2017 Election?
Labour had an election program that explicitly appealed to the young voters and campaigned with a program that at least attempted to tackle the UK’s vast problem of intergenerational inequalities and social problems that we highlighted elsewhere to be at heart of the EU Referendum result [also here]. This may have helped mobilise (young) voters to turn out to vote. At the same time, the Conservative manifesto had some provisions which would have entailed further benefits cuts to older voters, possibly inducing some of the older voters, who otherwise would not have voted, to turn up and vote.
The next picture below plots out the estimated effect of differential population age group shares (as per the 2011 census) on overall turn-out. This contains something of a surprise: Turn-out dropped significantly in places that have a high share of residents aged between 45-60 (as per the 2011 census), i.e., those aged 51 to 66 as of 2017. The effect is stark: constituencies with an average share of population in the 45-60 year bin saw a -15 percentage point drop in turnout statistically attributed to this group, with only a moderate increase in the top bin possibly due to compositional changes. It is unlikely that the overall differences are attributable to the naturally changing age composition since only two years passed since the 2015 election.

There are also significant upticks among the younger cohorts, especially those aged younger than 15 in 2011 and those aged between 30 and 45 in 2011. Again it is unlikely that these reflect mechanical compositional changes.
What these results seem to suggest is that the major swing in turnout was due to the group of individuals that were aged 45-60, which would be aged around 51-66 in 2017. It is this group that appears to have turned out significantly less relative to 2015, while relative to this group, younger voters increasingly turned up to vote. This could possibly indicate that low turnout in the traditionally conservative leaning older voter base along with higher turnout of younger voters, contributed to the surprise Labour performance.
In the next section, I will show that the finding is robust to a difference-in-difference estimating framework. This empirical approach essentially computes the differences in the estimated two curves, while at the same time, removing a lot of the unobserved confounders that could be distorting the above descriptive analysis. We can then also turn to consider indirect evidence on which parties appear to have benefited from increasing turnout.
Which party benefited from changing turnout? Some Regression Evidence
A simple way to address this question is to study turnout and the vote shares for the Labour and Conservative party in a reduced form panel regression, comparing outcomes in constituencies in 2017 relative to 2010 and 2015.
We can use a measure of the (potential) share of young voters based on the age composition of constituencies as per the 2011 census. The question to ask here is whether turnout increased differentially in constituencies that boast an, on average, younger electorate. This can be done in a difference-in-difference framework, thus exploiting variation only within constituencies over time. In particular, I estimate the following difference-in-difference specification using a balanced constituency level panel data set across the 2010, 2015 and 2017 UK general elections.

Where Intc captures a cross sectional measure that varies across parliamentary constituencies. There are three dependent variables I look at: overall turnout as a percent of the potential electorate, the share of the Labour party and the share of the Conservative party. In terms of Interaction terms, I study the (resident) population share that is younger than 30 and older than 60 based on the 2011 census.
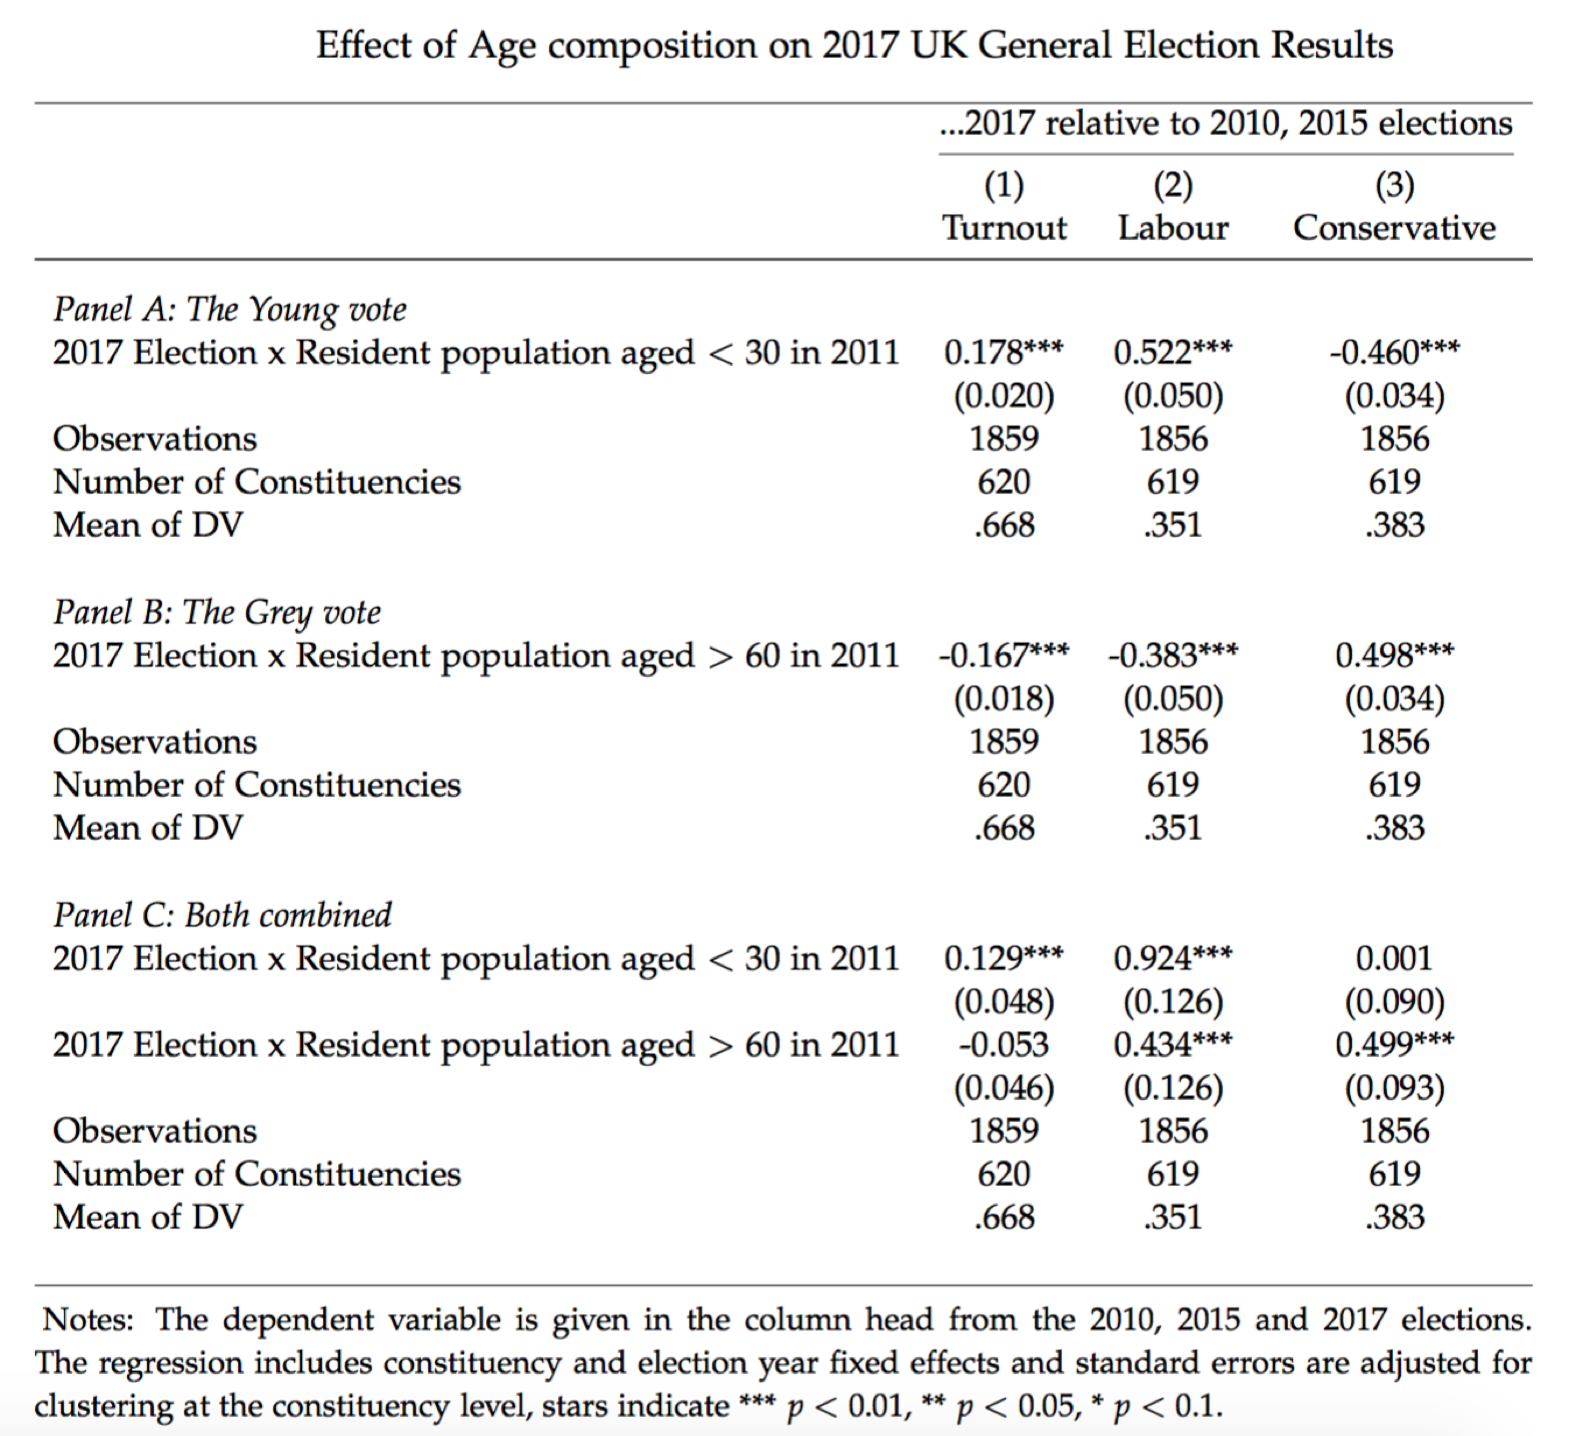
The results are presented in the below table. Panel A focuses on the “young vote”. The results confirm the prior assessment that turnout in places that have a relatively young voting population was markedly higher in 2017 relative to 2010 and 2015. A one standard deviation increase in the resident population share aged 30 or below in 2011 would increase the turnout by around one percentage point. Column (2) highlights that places with a relatively young population disproportionately voted Labour - a one standard deviation increase in the share of the population younger than 30 in 2011 translates into an increase in Labour vote share by 2.7 percentage points. Given that turnout, in relative terms, increased significantly for the young demographic, this can explain the significant swing.
The grey vote is presented in Panel B and the result here is basically a mirror image compared to Panel A. A higher share of population 60 or above implies less turnout (relative to having a younger population) and translates into markedly lower vote shares for the Labour party, but increased vote shares for the Conservatives.
This Table is only meaningful if we contrast the “grey vote” with the “young vote” relative to a common omitted category - that is the age group between 30 and 60, where we saw that turnout dropped most relative to 2015. This is presented in Panel C. Here we see that relative to this “middle age” group, constituencies that have a relatively young population saw a dramatic increase in Turnout. Turnout among the older population stayed pretty much constant.
Column (2) and (3) highlight that places with a relatively young population disproportionately voted Labour. A one percentage point increase in the resident share of young people relative to the middle category of 30 - 60 year aged residents translates nearly one to one into an increased vote share for the Labour party (column 2). However, the results also indicate that in places that have a relatively high share of old people, the population split their vote equally between the Labour Party (column 2) and the Conservative Party (column 3) relative to the 2010 and 2015 elections.
What do we learn from this?
First of all, the results here present some good news for democracy in the UK over all. Despite the unfairness of the first-past-the-post electoral system, turnout seems to have increased in the past 7 years since 2010. The 2017 election saw significant increases in turnout among the young relative to the traditionally conservative leaning age group between 45-60.
This has helped contribute to the surprise performance among the Labour party.
Weak voter turnout among the young, relative to the older population in the UK has resulted in a political outcomes that naturally favour older cohorts, fuelling the already dramatic increase in inequality across the different generations, which increasingly threaten the UK’s social cohesion. While many economists may agree that Labour’s campaign promises amount to economic suicide, the party at least attempted to address — through its program — the UK’s structural social problems that my other work suggests lies at the heart of the Brexit vote.
The results of this analysis suggest that the major reshuffles in turnout were predominantly due to the (soon to be) grey voters choosing not to turn up to vote in 2017 relative to younger voters. The Labour party was the big winner, catching almost all the votes from this relative increase in the share of young voters. However, relative to the age groups between 30 and 60, places with an older resident population saw their vote split between the Conservatives and Labour, possibly due to the Conservatives party manifesto, which suggested further benefits cuts that mainly impacted the older population.
This post is very lightly revised version of one appearing on Dr. Fetzer’s own blog