
EEO-1 employment data document the vast over-representation of Asian Americans and vast under-representation of African Americans at tech companies in recent years. How did this happen?
How the Rainbow PUSH Coalition brought tech EEO-1 reports to light
In the winter of 1999, Reverend Jesse Jackson, head of the Rainbow PUSH Coalition, was in San Jose, California as the guest of the recently formed Coalition for Fair Employment in Silicon Valley. Concerned with discrimination against Blacks, the Fair Employment group had found that only 175 of 1,434 tech companies in the Bay Area had bothered to file the reports, required of all major federal contractors, with the U.S. Department of Labor.
Jackson criticized U.S. tech companies for importing workers from abroad on H-1B visas while neglecting the employment of qualified minorities in the United States. As part of its “Silicon Valley Project,” the Rainbow PUSH Coalition spent $51,000 to buy $1,000 in shares of each of 51 tech corporations in order to negotiate with the companies as shareholders to include more minority members on their boards.
In May 2000, the Silicon Valley Project held a Digital Connections 2000 Conference, with CEOs of AMD, Cisco, Hewlett-Packard (HP), and Intel reportedly in attendance. The Conference announced, “a three-to-five-year plan for the high tech industry to educate, train, prepare, and, employ 200,000 young people in local communities.” The Project held two subsequent conferences in April 2001 and April 2002. With the tech industry in a deep downturn in 2001-02, however, the Project did not push its agenda at any of the annual general meetings of the 51 companies in which it held shares.
By 2005, the Silicon Valley Project was in a state of suspension—but, as it turned out, far from moribund. After a hiatus of almost a decade, in March 2014 Rev. Jackson was at the annual general meeting of HP, as the Rainbow PUSH Coalition relaunched what was now called the Silicon Valley Digital Connections Project “to expand the participation of Blacks and people of color—commensurate with our consumer base and population—in all dimensions of the technology industry.” According to the New York Times’ coverage of the HP meeting: “Besides HP, both before and during the meeting, Mr. Jackson cited Twitter, Google, Facebook, Apple, among other companies, as places needing greater minority employment and leadership.”
In May, Jackson attended the annual general meetings of eBay, Google, and Facebook, demanding that these companies make public their EEO-1 diversity employment reports, which, since 1966, every company with 100 or more employees in the United States is required to submit annually to the Equal Employment Opportunity Commission (EEOC). At the Facebook meeting, Jackson asked: “Will Facebook voluntarily and publicly release [its] EEO-1 report?” Sheryl Sandberg, the company’s chief operating officer, gave an evasive and convoluted response: “We believe, as you do, that transparency is really important, and we’re on a path to get there. We’re looking at our numbers internally. We’re seeing growth already from what we’re doing, and we would like to be on a path to share them both internally and eventually externally.”
Sandberg’s treatment of the request for data contrasted starkly with the straightforward mea culpa that Jackson had heard at the Google meeting the week before. Responding to a pre-arranged speech by Jackson at the beginning of the Q&A session, David Drummond, an African American executive in charge of Google public policy, said: “Many companies in [Silicon Valley] have been reluctant to divulge that data, including Google, and, quite frankly, we are wrong about that.” Drummond promised the release of the EEO-1 report “next month.” Less than two weeks later Google made the report public.
This breakthrough won praise from Jackson, who issued a statement: “We believe it is time for other tech companies to follow Google’s lead. We challenge them to also voluntarily release their Equal Employment Opportunity Data/Reports.” Gradually, other tech companies followed suit. In June, Yahoo released its EEO-1 report, and by the end of 2014 eBay, Facebook, and LinkedIn had done so as well. In December, Jackson attended the Microsoft annual meeting, and a month later the company made its EEO-1 report public. Jackson was at the Apple meeting in March 2015, and in August Apple released its EEO-1 report for 2014. The process was repeated with Amazon in June.
As the result of this persistent activism, anyone who was interested could now see exactly how many people a company employed in ten different hierarchically ordered occupational categories by race, ethnicity, and gender. The Center for Investigative Reporting launched a project to monitor and encourage the public release of EEO-1 data for 2016 by “211 of the largest Silicon Valley tech companies”, and posted on its project website the EEO-1 reports of the 26 companies that complied.
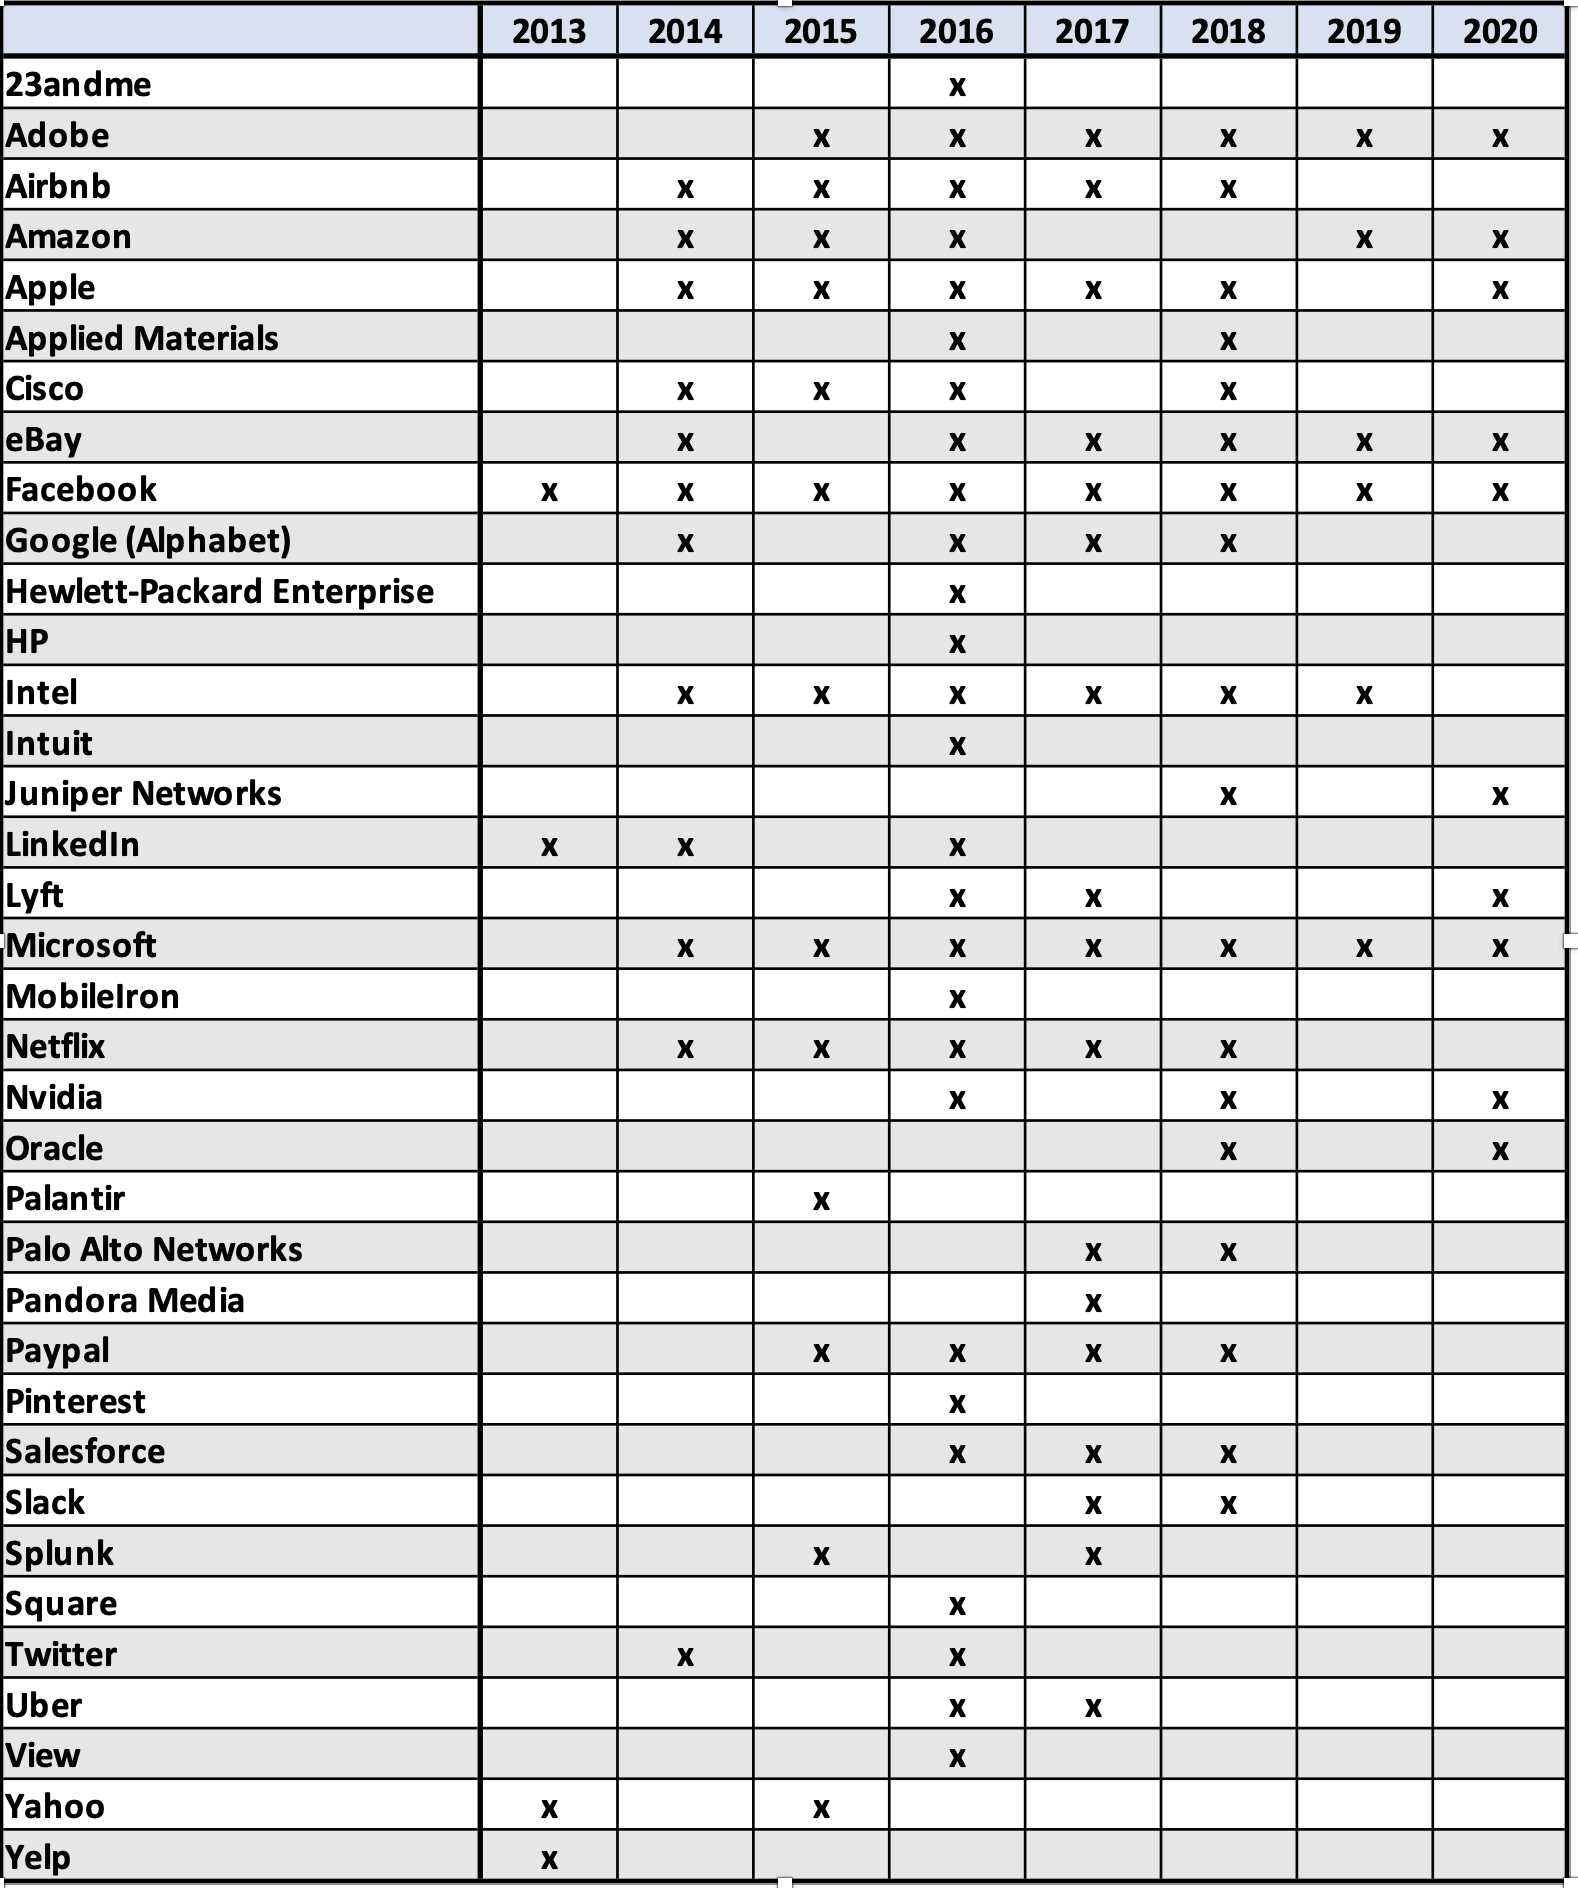
Our own searches, through December 2021, have found EEO-1 reports, for 2013-2020 for the tech companies (most of them based in Silicon Valley) indicated in Table 1:
Table 1: Public releases of EEO-1 reports by tech companies, 2013-2020
How to make use of the EEO-1 data
How can we use these EEO-1 reports to identify the existence of employment inequalities at tech companies? This is a question that the three of us posed at a conference on the economics of race, held in Detroit in November 2016, organized by the Institute for New Economic Thinking (INET). At the conference, we presented an outline of our INET-funded research project, “Fifty Years After: Black Employment in the United States under the Equal Employment Opportunity Commission.”
Now, after years of research, analysis, and writing, the value of the EEO-1 data, utilized in combination with many other information sources, is evident in five INET working papers that we have produced from the Fifty Years After project:
#1 “How the Disappearance of Unionized Jobs Obliterated an Emergent Black Middle Class” (June 2020), in which we provide an overview of our findings on how from the early 1980s the rationalization, marketization, and globalization of corporate employment relations eroded the stable, well-paid blue-collar job opportunities in major U.S. corporations that a significant proportion of the Black labor force had begun to obtain in the 1960s and 1970s.
#2 “Employment and Earnings of African Americans Fifty Years After: Progress?” (July 2020), in which we compile data on trends in education, employment, income, wealth, and health that provide a quantitative picture of the derailment of the engine of equal employment opportunity for Blacks that the Civil Rights Act of 1964 had sought, with some initial success, to set in motion.
#3 “Employment Mobility and the Belated Emergence of the Black Middle Class” (January 2021), in which, after surveying the types of employment opportunities that African Americans found in the industrial North and Midwest in their Great Migration from Southern agriculture from the 1910s to the 1960s, we engage in a detailed analysis of the upward mobility in the 1960s and 1970s of Blacks with no more than a high-school education to well-paid unionized employment opportunities, epitomized by semi-skilled operative jobs in the automobile industry.
#4 “The Unmaking of a Black Blue-Collar Middle Class” (May 2021), in which we analyze how from the late 1970s, the impact of global competition and the offshoring of manufacturing combined with the financialization of the corporation to decimate these stable and well-paid blue-collar jobs.
#5 “Equality Denied: Tech and African Americans” (just published, in which we delve deeply into the EEO-1 reports that major tech companies have made public as a prelude to our analysis of how inequalities in K-12 education, the erosion of affirmative action in employment, U.S. immigration policy for STEM (science, technology, engineering, and mathematics) employment, and systemic social barriers to accessing employment opportunities have severely limited Blacks as a group in obtaining the well-paid, high-level jobs that the tech companies have to offer.
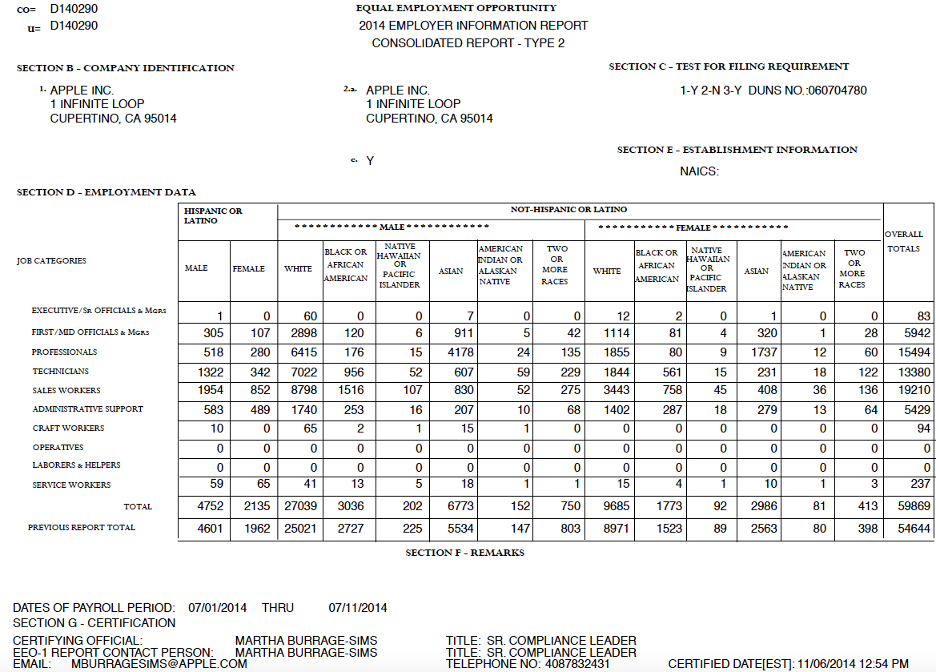
Requiring advanced education and cumulated work experience, these high-level jobs are most numerous in the EEO-1 “professionals” category (which includes scientists and engineers), as shown, for example, in this facsimile of Apple’s EEO-1 submission for 2014:
Apple’s 2014 report provides a snapshot of diversity in employment at the company at a point in time, while its release of EEO-1 reports for 2014-2018, and 2020 makes it possible to analyze changes in Black employment over time—albeit only over a six-year period (Apple has been submitting EEO-1 reports since 1978 or 1979). Table 2 summarizes Apple’s total U.S. employment by occupational category for 2014, 2017, 2018, and 2020.
Table 2. Apple’s U.S. employees by EEO-1 occupational categories, 2014, 2017, 2018, and 2020
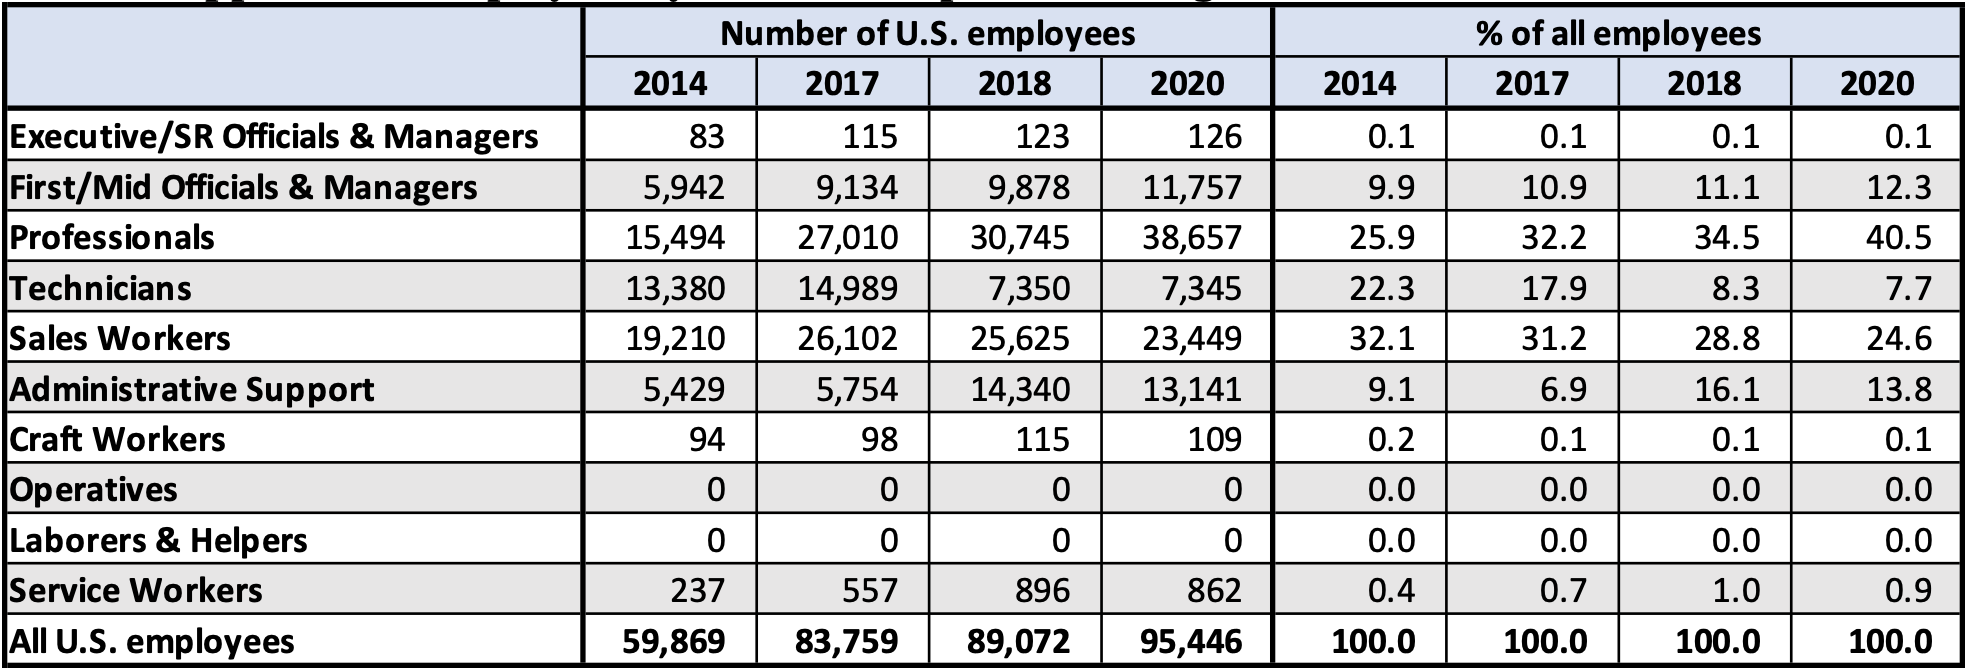
Source: Apple EEO-1 reports to the U.S. Equal Opportunity Employment Commission.
Apple doubled its management ranks below the senior level from 2014 to 2020, as this personnel went from 9.9% of 59,869 U.S.-based employees in 2014 to 12.1% of 95,446 employees six years later. Much more important, however, was the vast expansion of “professionals” at Apple. They increased by 2.5 times from 2014 to 2020, rising from 25.9% to 40.5% of all Apple’s U.S.-based employees. At Apple, these two occupational categories have been providing tens of thousands of highly paid employment opportunities in the United States.
After professionals, Apple’s second-largest occupational category is “sales workers”—mainly consisting of the people who serve customers in Apple stores. In the Boston area, the base pay of an Apple “sales specialist” averages $19 per hour, or $39,520 full-time per year. About half of all Black employees at Apple over these years for which we have data were sales workers, a lower-paid occupational category
In 2020, the other large group of lower-paid workers was in “administrative support.” Note from Table 2 that from 2017 to 2018 there was a precipitous drop in “technicians” employed but simultaneously an even greater increase of employees in administrative support. For reasons unknown to us, Apple decided in 2018 to reclassify thousands of employees from a higher-level to a lower-level occupational category.
Table 3 shows that at Apple, African Americans are much better represented in lower-paid than in higher-paid occupations. For purposes of comparison, Blacks were 11.4% of the U.S. civilian labor force in 2020. From 2014 to 2020, Apple increased its total U.S. employment by almost 60%—a net increase of 35,587 jobs. Apple could have used the dramatic expansion of U.S. employment to improve the company’s Black employment significantly. Instead, African Americans secured only a very modest increase in representation among all Apple’s U.S. employees, from 8.0% in 2014 to 8.5% in 2020.
Table 3: Blacks in Apple’s U.S.-based labor force, 2014, 2017, 2018, and 2020
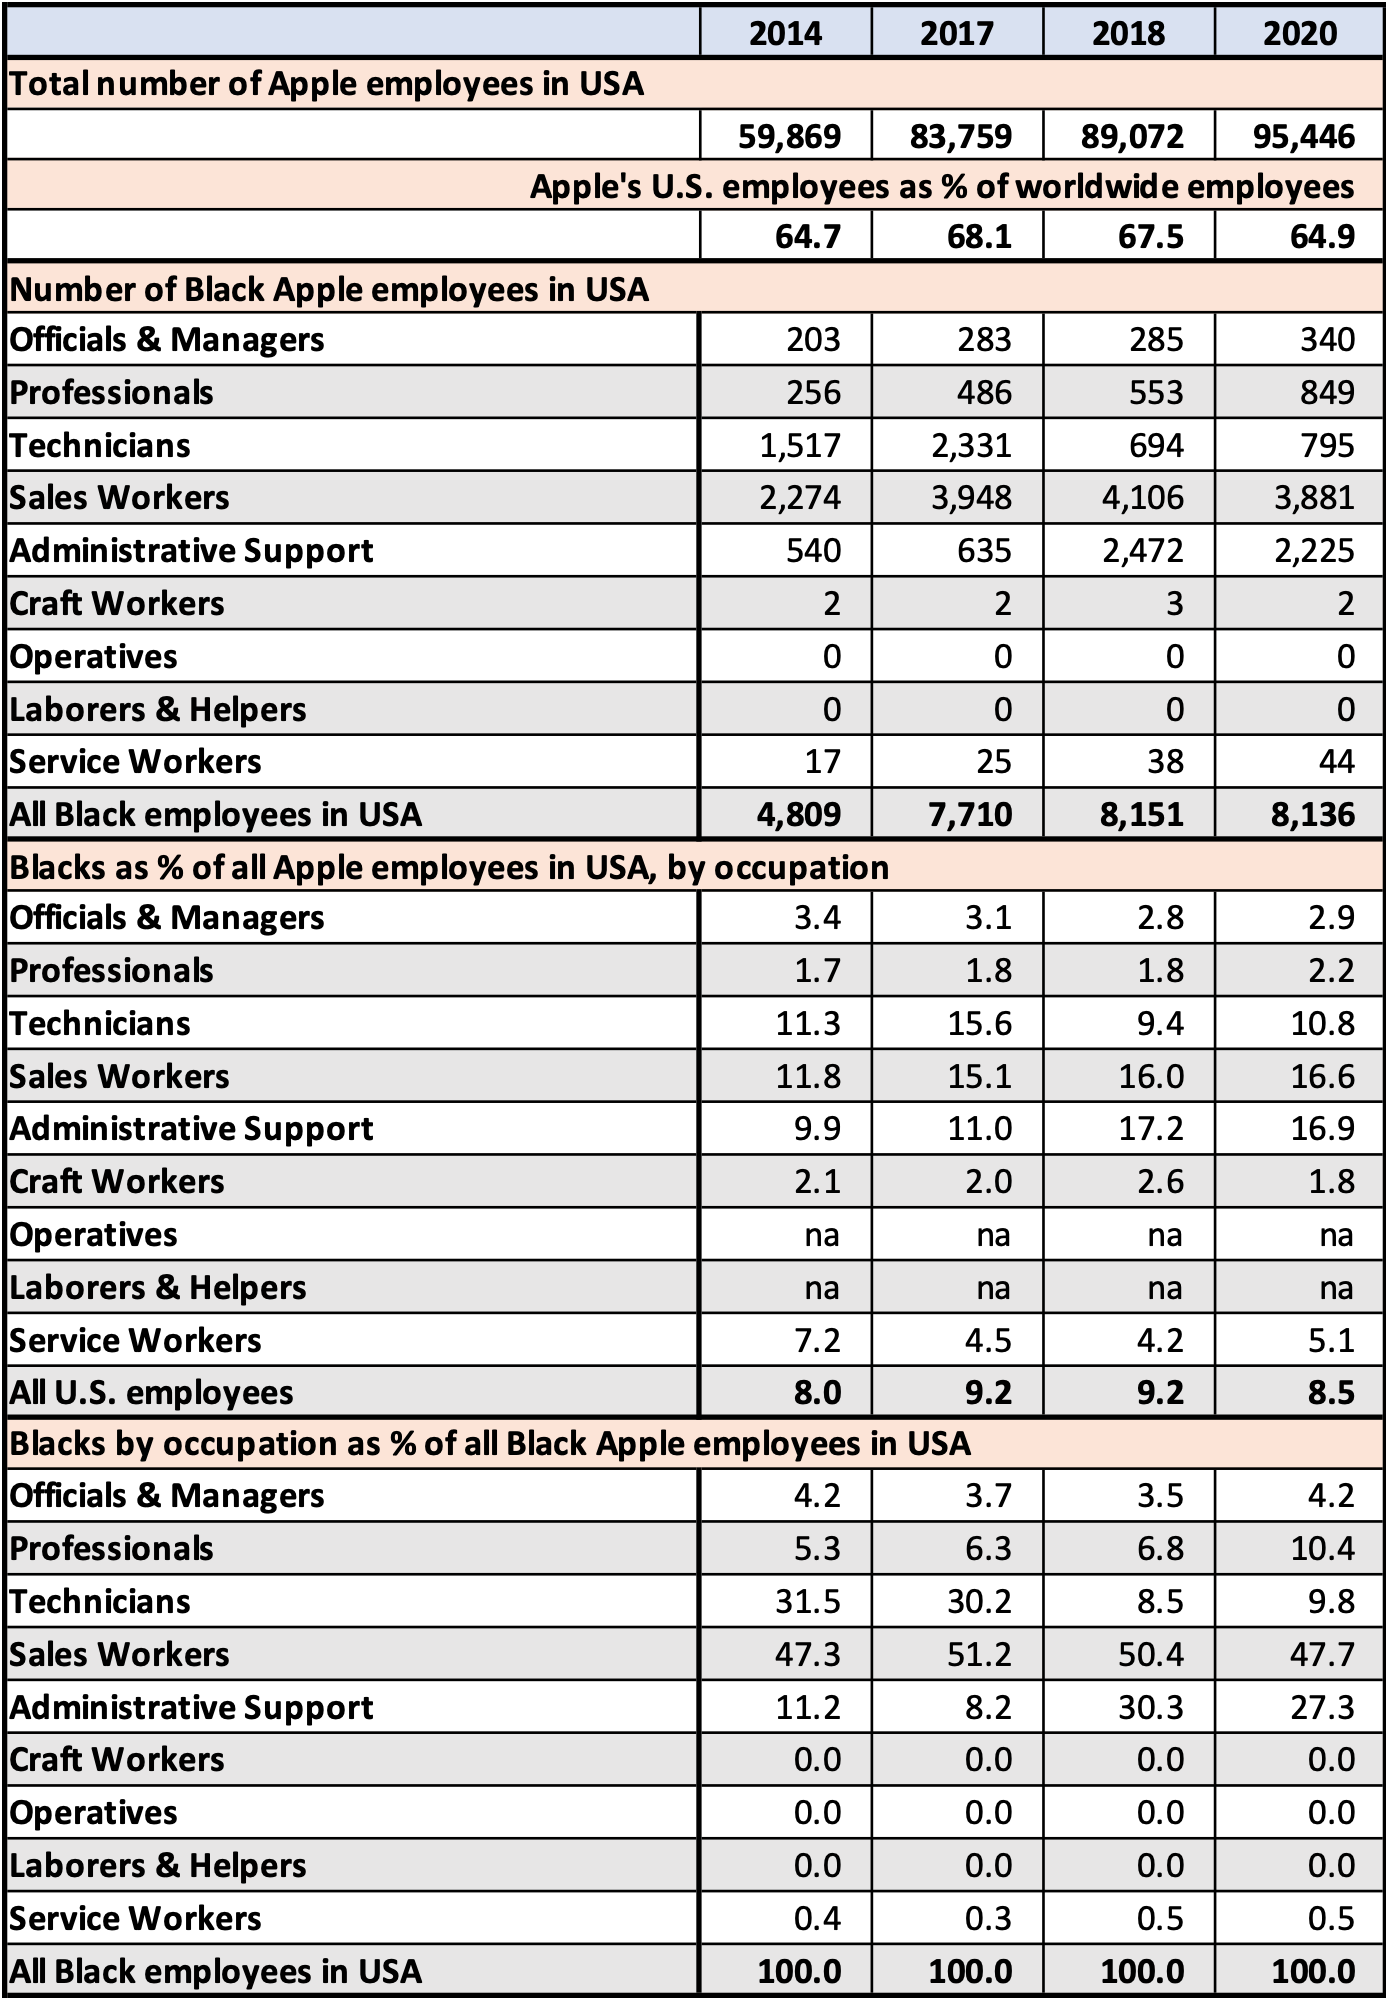
Note: Data for senior and mid-level officials and managers have been combined.
Source: Apple EEO-1 reports to the U.S. Equal Opportunity Employment Commission.
Even though the number of Black professionals at Apple more than tripled from 256 in 2014 to 849 in 2020, the Black share of this occupational category was only 2.2% at the end of the period. Meanwhile, the proportion of Blacks among “officers & managers” declined from 2014 to 2020. Blacks, therefore, were massively under-represented at Apple in the higher-level occupational categories, and the huge increase in Apple’s total U.S. employment over the six years did little to improve the situation.
The publicly released EEO-1 data also reveal that the meager share of Blacks as professionals at Apple also prevails at other leading tech companies. Table 4 provides EEO-1 data for professionals at the 12 tech companies with the highest levels of U.S. employment among those that made public their EEO-1 reports for 2016 and/or 2017 (see Table 1 above). The Black share of professionals ranges from a low of 1.8% at Apple to a high of 6.4% at Hewlett-Packard Enterprise (HPE). For nine of the 12 companies, Black representation was between 2.6% and 3.6%.
Table 4: Comparison of the employment of professionals by race/ethnicity/gender in the U.S.-based labor forces of 12 major tech companies, 2016 or 2017
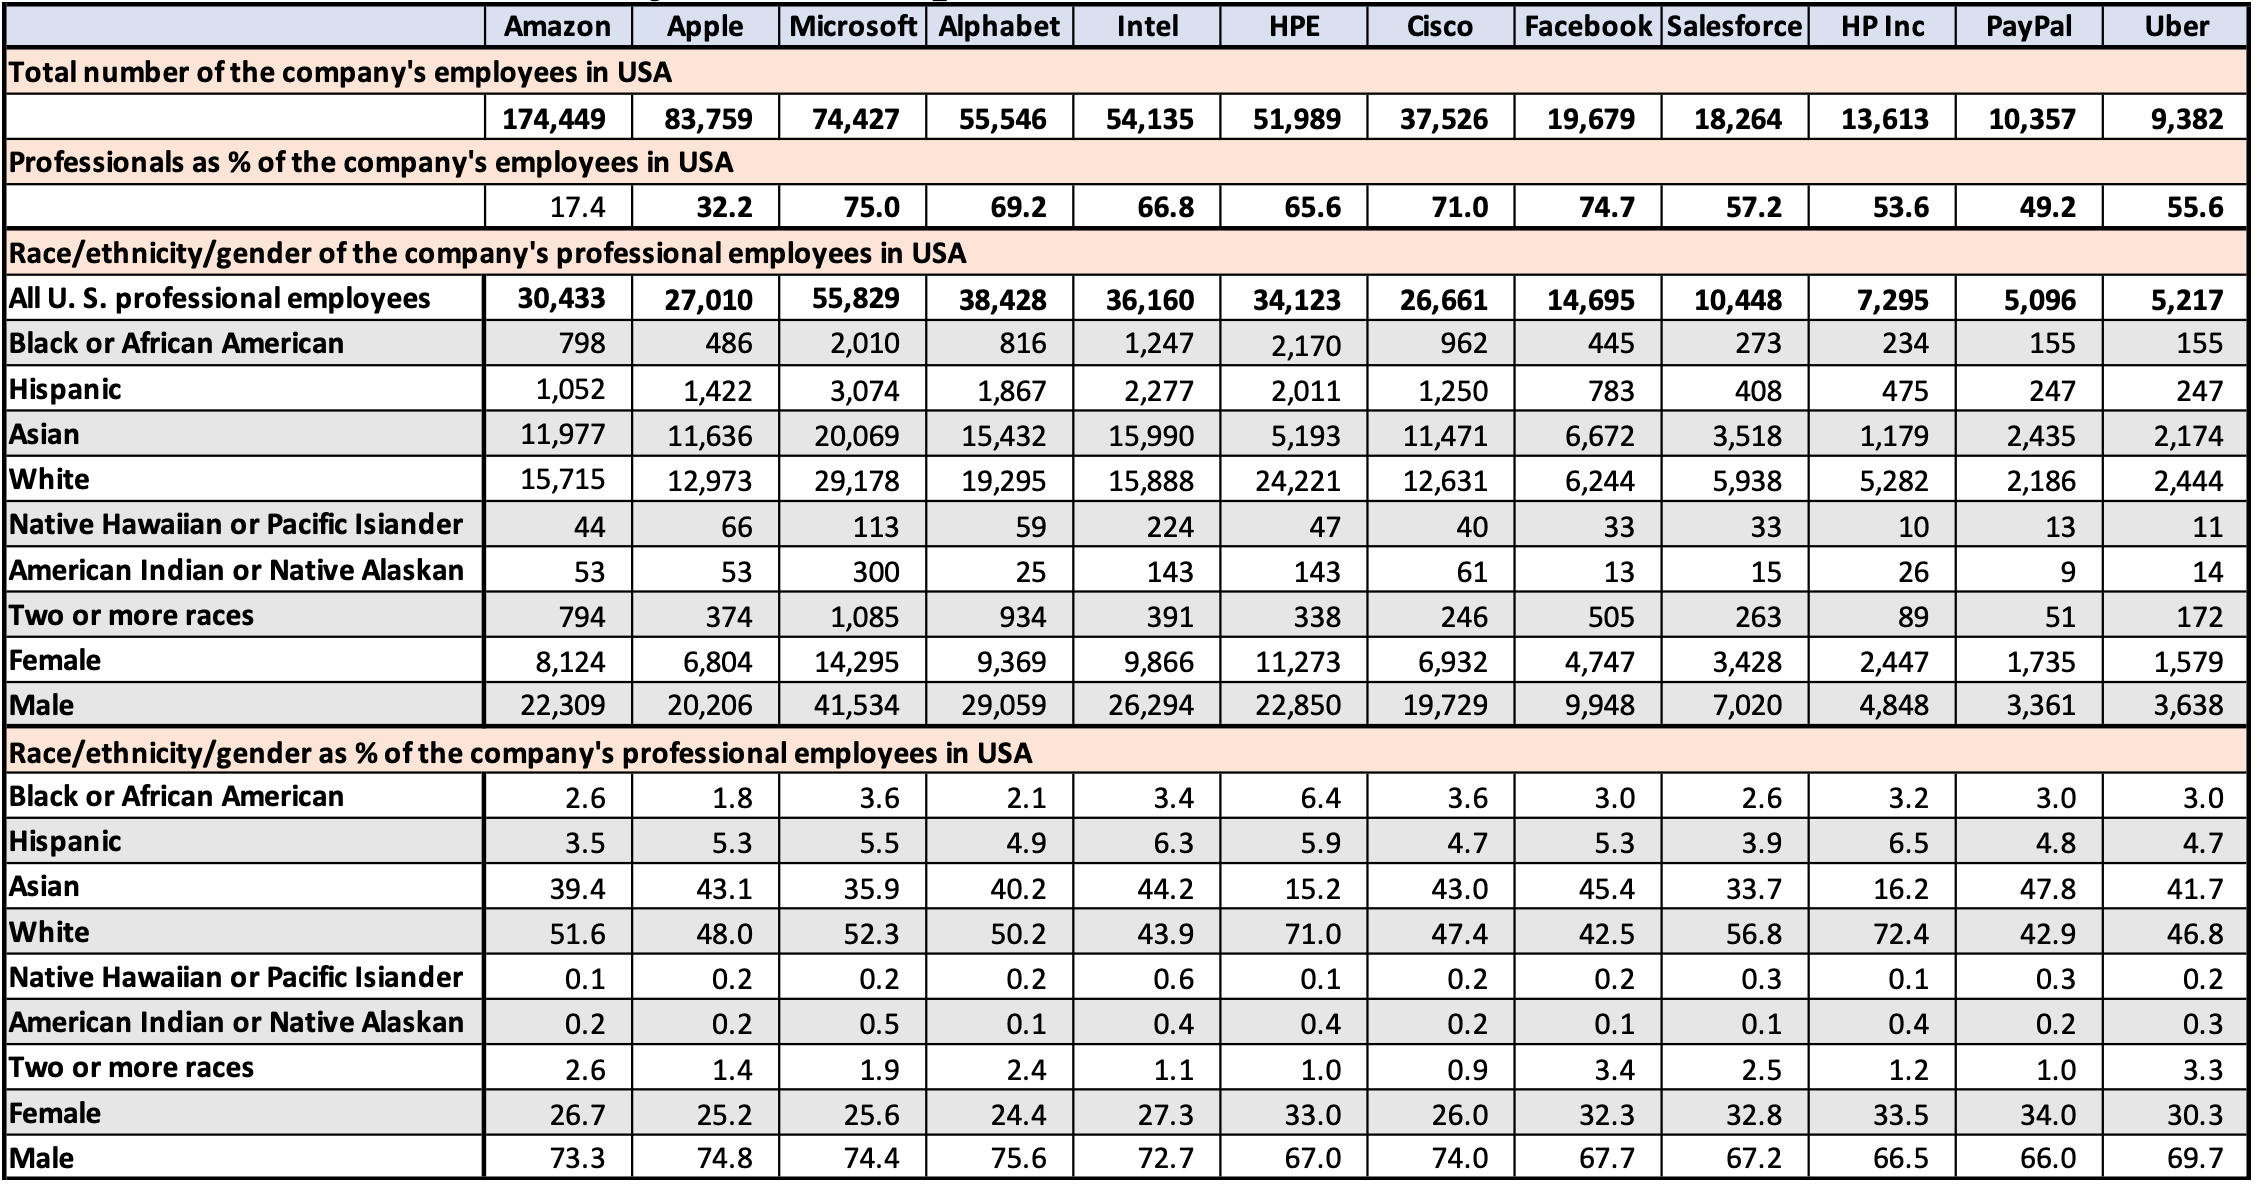
Source: Company EEO-1 reports to the U.S. Equal Opportunity Employment Commission.
As an outlier with Blacks as 6.4% of professionals, HPE is of considerable interest. HPE, which is engaged in information-technology services, and HP Inc., which produces computers and printers, came into existence as the result of the breakup of Hewlett-Packard (HP) in 2015. As we discuss at some length in our “Equality Denied” paper, the relatively high proportion of Blacks as professionals at HPE in 2016 was a legacy of HP’s adoption of aggressive affirmative-action policies fifty years earlier in 1966, immediately after the launch of the EEOC.
Founded in 1939 at the heart of the industrial district that by the 1970s would become known as Silicon Valley, HP was a company that became extraordinarily successful by enabling and encouraging its employees to pursue a career-with-one-company (CWOC). Known as The HP Way—the title of founder David Packard’s best-selling book published in 1995—the company provided employees with secure internal career paths along with nonportable defined-benefit pensions based on years of service with the company. It was within HP’s “Old Economy” organizational structure that African Americans gained access to a larger proportion of higher-level employment opportunities than would subsequently be the case at “New Economy” companies such as Intel, Microsoft, Apple, and Cisco.
Even though from 1999, with the arrival of Carly Fiorina as Hewlett-Packard CEO, the company abandoned The HP Way, the legacy of Blacks in professionals employment persisted, as reflected in the 6.4% of U.S. professionals who were Black at HPE in 2016. In contrast, HP Inc., with its proportion of Blacks as professionals in 2016 at only 3.2% (as shown in Table 4) originated in large part from Compaq Computer, a New Economy company founded in Texas in 1982 and acquired by HP in 2002. Unlike the part of HP that became HPE, Compaq did not have a legacy of affirmation-action policies to employ African Americans as professionals.
Much the same story of the importance and persistence of the historical legacy of affirmative action can also be told about IBM. Founded in Endicott, New York as Computing-Tabulating-Recording Company in 1911 and renamed International Business Machines in 1924, IBM developed a CWOC policy under Thomas Watson Sr., CEO from 1914 to 1956, which was continued under his son and successor as CEO (to 1971), Thomas Watson Jr. Abiding by the principle of never laying off an employee involuntarily, IBM’s system of “lifelong employment” persisted through the 1980s, during which time IBM, like HP, adopted affirmative-action policies to employ Blacks as professionals.
Between 1990 and 1994, however, IBM cut its worldwide employment from 374,000 to 220,000, for the purpose of ridding itself of the system of lifelong employment. From top to bottom, employment at IBM became “marketized” as it transitioned from the “Old Economy business model” to the “New Economy business model,” as analyzed in William Lazonick, Sustainable Prosperity in the New Economy? Business Organization and High-Tech Employment in the United States (Upjohn Institute 2009). IBM has not released any of its EEO-1 reports in recent years. In doing research for his Sustainable Prosperity book, however, Lazonick collected (and preserved) EEO-1 data that IBM published for 1996 through 2008, much of it (now invisible) on IBM’s corporate website.
From these data as well as an important Wall Street Journal article on Black employment published in 1993, we know that Blacks did not do well with IBM’s transition to the New Economy business model. In 1990 IBM employed 20,222 Blacks in the United States, with that number declining to 18,677 in 1991. By then, IBM was in the process of dramatically slashing its labor force, and by 1996 U.S. employment of Blacks at IBM had been reduced to 12,412, a drop of 38.6% from 1990. Nevertheless, Black representation among IBM’s U.S. employees increased from 9.1% in 1990 to 9.9% in 1996. But thereafter it steadily declined, falling to 7.5% in 2008, the last year for which IBM has provided EEO-1 information.
As officials and managers, Blacks held 6.9% of IBM’s U.S. positions in 1996 but only 5.5% in 2008. In the professionals category, in 1996, IBM employed 3,641 Blacks, representing 6.6% of the occupational category; in 2008, the number was 3,347 Black professionals, equal to 6.8% of all U.S professionals. Compared with the sub-four percentages for the 11 tech companies other than HPE in Table 4, the Black professionals’ proportion at IBM was high. Through the 1980s both HP and IBM had adhered to the CWOC norm, on the basis of which aggressive, and effective, affirmative-action policies were pursued, with enduring results, even as The HP Way and IBM’s lifelong-employment system ceased to exist.
From the 1990s, however, neither HP nor IBM offered significant employment to Black blue-collar workers. In 1984, HP employed 2,914 craft workers, of whom 594, or 20.4%, were “minorities”; and 12,605 semiskilled operatives, of whom 3,852, or 30.6%, were minorities. Two decades later, in 2004, HP employed only 18 craft workers in the United States, of whom three were Black and 15 were white, and only 239 operatives of whom 30 were Black, 38 Hispanic, 32 Asian, two Native American, and 137 white.
In 1996 (after considerable downsizing), IBM employed 1,628 craft workers in the United States, of whom 161 (9.9%) were Black, and 15,415 operatives, of whom 3,474 (22.5%) were Black. By 2008, the IBM numbers were 1,002 craft workers, of whom 84 (8.4%) were Black, and only 1,229 operatives, of whom just 78 (6.3%) were Black.
Most of the 12 tech companies in Table 4 do no manufacturing in the United States. One exception is Intel, which employs thousands of people in its U.S. semiconductor fabs. But of Intel’s 51,267 U.S. employees in 2019, only 405 were craft workers (13 Black) and none were operatives, laborers & helpers, or service workers. Semiconductor fabrication is not a source of blue-collar jobs in the United States.
In sharp contrast, as detailed in our “Equality Denied” paper, in 2020 Amazon employed 622,077 laborers & helpers in the United States, a 15-fold increase from 41,521 in 2014, as the company expanded its warehouses and delivery services. Of this net increase of 580,556 laborers & helpers jobs, 33.0% were filled by Blacks. As a result, among laborers & helpers, Black representation increased from 23.6% in 2014 to 32.4% in 2020, when there were 191,757 Blacks in this category. Laborers & helpers represented 85.9% of all Amazon’s Black employees in the United States in 2014 and 84.8% in 2020.
Nevertheless, at Amazon, there was progress for Blacks higher up. Among officials and managers, Black representation increased from 4.2% in 2014 to 10.8% in 2020, when there were 5,438 Blacks in this category. Among professionals, Black representation increased from 2.1% in 2014 to 3.9% in 2020, when there were 3,592 Blacks in this category. With Amazon’s dramatic increase in U.S. employment from a total of 77,179 in 2014 to 918,261 in 2020, Blacks experienced improvement higher up the hierarchy but obtained vastly more jobs in the low-paid laborers & helpers occupation.
Policy implications of our analysis of the EEO-1 data
EEOC provides industry aggregates for EE0-1 data in its annual Job Patterns for Minorities and Women in Private Industry publications, which we have put to use in our analysis of the rise and decline of Blacks as semiskilled operatives in automobiles and other manufacturing industries in the #3 and #4 Fifty Years After working papers, listed above. The most recent EEOC Job Patterns data are for 2018.
A confidentiality provision in Section 709(e) of Title VII of the Civil Rights Act of 1964 prohibits EEOC from releasing data with identifiable information on individual companies that submit EEO-1 reports. In our view, in an age in which most U.S. companies purport to have embraced diversity in employment as a corporate objective, that prohibition should be lifted. The corporations that have been voluntarily publishing their EEO-1 reports should be advocating this legislative change. Our project, and particularly our “Equality Denied” paper, demonstrates the value of these data, publicly disclosed, for understanding racial inequality in the United States. Moreover, the work that we have done has been confined to the African American experience. The company-level EEO-1 data can be immensely useful for studies along many different dimensions of race, ethnicity, and gender.
EEOC should also implement the initiative, put forward under the Obama administration, to add pay data to the information that companies submit in their annual EEO-1 reports. The requirement to report these data was canceled under Trump. Nevertheless, since March 31, 2021, the California Department of Fair Employment and Housing has required every company with 100 or more employees in the United States and at least one employee in California to submit these pay data annually.
To date, the only such data that has been made public is by Intel for 2017-2019 as part of the company’s “Early Resolution Agreement” with the U.S. Department of Labor to allocate $5 million in pay adjustments “to resolve allegations of systemic pay discrimination against female, African American and Hispanic American employees at its facilities in Arizona, California, and Oregon.” Our “Equality Denied” paper contains an analysis of the insights into employment and pay discrimination that can be derived from the Intel EEO-1 pay data for 2019.
Data disclosure, however, only permits us to identify a problem. The critical next step is to understand the sources of the problem. In “Equality Denied,” our analysis of Black exclusion from STEM employment focuses on a) stark differences among racial and ethnic groups in educational attainment and performance relevant to accessing STEM occupations, b) the decline in the implementation of affirmative-action legislation from the early 1980s, c) changes in U.S. immigration policy that favored the entry of well-educated Asians, especially with the passage of the Immigration Act of 1990, and d) social barriers that qualified Blacks have faced relative to Asians and whites in accessing tech employment as a result of a combination of statistical discrimination against African Americans and their exclusion from effective social networks.
Central to any improvement in employment opportunity in the United States, be it for members of the U.S. labor force generally or for under-represented racial, ethnic, and gender groups, in particular, is corporate investment in the productive capabilities of people and the rewarding of those capabilities with higher wages and benefits a well as more stable employment. As our research organization, the Academic-Industry Research Network, with the support of the Institute of New Economic Thinking, has shown in a growing number of studies, an overriding barrier to achieving stable employment and equitable living standards in the United States is the use of corporate cash to do massive stock buybacks as open-market repurchases. As, in his widely read Harvard Business Review article, “Profits Without Prosperity,” Lazonick puts it in the subtitle “stock buybacks manipulate the market and leave most Americans worse off.”
In the forthcoming conclusion to our Fifty Years After project, we will take up this problem of the financialization of the U.S. business corporation, as manifested by stock buybacks, as it relates to employment opportunity for Blacks. Suffice it to assert here that stock buybacks undermine employment opportunity and, given the large deficit in employment opportunity that continues to face African Americans, buybacks in practice function as an instrument of systemic racism.
As it happens, the U.S. corporation that is by far the largest offender in using stock buybacks to manipulate its stock price is also the worst performer among the tech companies in Table 4 in the representation of Blacks among its professionals employed in the United States. From October 2012 through December 2021, Apple gave away $484 billion in buybacks, equal to 92% of its profits while also distributing $118 billion as dividends, another 23% of profits. Lazonick and colleagues have subjected Apple’s financialized behavior to a series of critiques. We will end this article and look forward to our project’s concluding paper with one illustrative anecdote concerning Apple’s anti-social priorities in resource allocation.
On June 11, 2020, in the wake of the Black Lives Matter protests after the murder of George Floyd, Apple announced a $100-million “Racial Equity and Justice Initiative.” In a Twitter video, Apple CEO Tim Cook declared: “The initiative will challenge the systemic barriers to opportunity and dignity that exist for communities of color and [in] particular for the black community.” $100 million is a large wad of cash. But it amounted to only 0.14% of the $72.4 billion that Apple wasted on buybacks in fiscal 2020 and 0.02% of the $484 billion that Apple has used to manipulate its stock price over the past 8+ years. As a challenge to “systemic barriers to opportunity and dignity” by America’s most profitable tech company, Apple’s initiative was way too little and way too late.