
Introduction
We are living in the age of consequences. The outbreak of SARS-CoV-2 uncovered our societies’ pre-existing structural weaknesses — which were the result of a pervasive political indifference to inequality, combined with decades of cuts to the most basic social protections and to wages, leaving large segments of our populations tragically vulnerable to the arrival of this virus (Marmot et al. 2020a, 2020b; Woolhandler et al. 2021).
Of course, the macroeconomic consequences of four decades of neoliberal management of the OECD economies were already there for all to see (Storm 2017): declining long-term growth (aka ‘secular stagnation’), suffocated by rising inequalities in income and wealth and by an obsessive-compulsive fiscal austerity by governments, but barely kept alive by rising (private and public) indebtedness and quasi-permanent asset-price bubbles (‘financialization’).
The neoliberal model suffered a first near-death experience in 2008, in the form of the Global Financial Crisis of 2008 and the ensuing not so Great Recession. It rather miraculously survived, helped by massive (taxpayer) support of governments and central banks and more by luck than skill. But in the process, it further toxified, as austerity deepened, and this fuelled the growth of (mostly right-wing) populism, destabilizing erstwhile stable democracies, notably Britain (‘Brexit’) and the U.S. (‘Trump’).
Hence, when, in early 2020, we let the corona-virus enter our societies through the front door, the virus rapidly found a deadly path through pre-existing socio-economic inequalities and vulnerabilities, with individuals and families at the bottom of the social and economic scale, who were missing out already long before the health emergency, suffering proportionally more, losing their health, jobs, lives, food security and educational opportunities. As daily infections rose and death counts mounted, most governments fitfully responded by imposing social distancing, mask-wearing, and lockdowns and by introducing spending measures to cushion the economic blow from the health emergency.
The scale of the intervention is unprecedented. Fiscal measures announced as of September 11, 2020, are estimated to equal $11.7 trillion globally (or close to 12% of global GDP). These measures and the worldwide recession have pushed global public debt to an all-time high of close to 100% of global GDP in 2020 (IMF 2020).
For more than one year we have been living through this health emergency and economic crisis and it is time to look back and take stock. What are the lessons which macroeconomists must learn from the SARS-CoV-2 crisis? I identify four main lessons in a new INET Working Paper. Before outlining these lessons, I will first consider a few stylized facts concerning the impacts of and responses to the COVID-19 crisis, based on empirical evidence for a sample of 22 OECD countries.
Stylized facts
For the world as a whole, cumulative confirmed SARS-CoV-2 mortality amounted to 2,476,526 deaths on February 23rd 2021, which is when the U.S. coronavirus death toll passed the tragic mark of 500,000 fatalities. Out of these 2.48 million confirmed corona-virus deaths worldwide, 1,006,817 deaths, or 43%, occurred in the panel of 22 OECD countries, listed in Figure 1. As is shown in the figure, the relative cumulative mortality impacts of COVID-19 vary greatly between countries – from 0.5 deaths per 100,000 persons in New Zealand to more than 190 deaths per 100,000 persons in Belgium. The U.S. and the U.K. have 149 and 178 deaths per 100,000 persons in their respective populations.
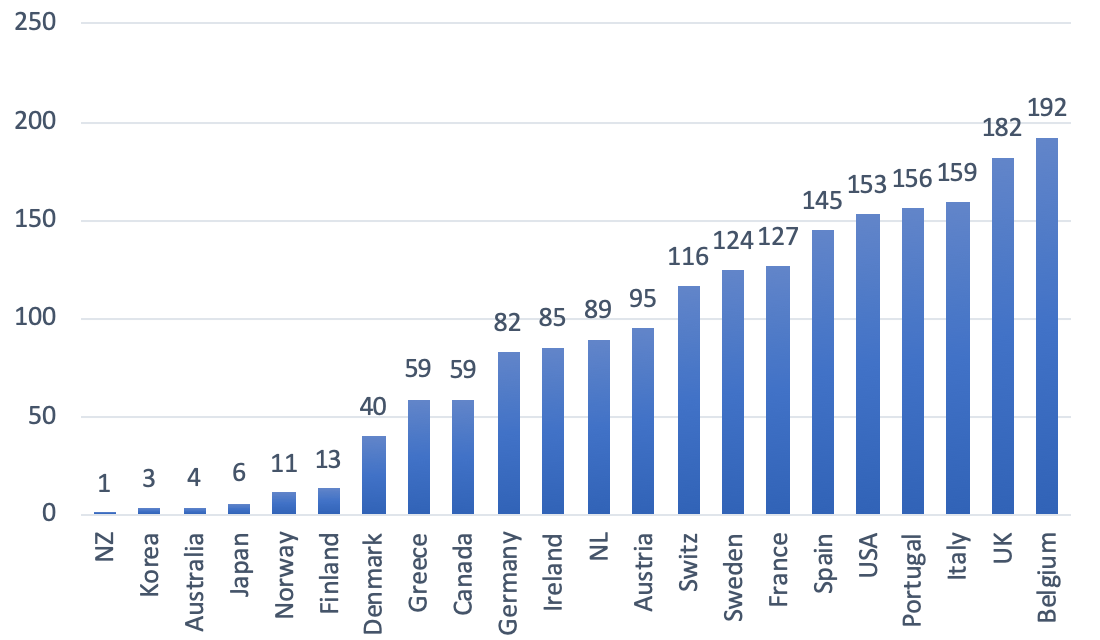
Figure 1: Cumulative confirmed COVID-19 deaths per 100,000 population Source: Johns Hopkins University & Medicine, Coronavirus Resource Center (https://coronavirus.jhu.edu/data/mortality); data up to February 23, 2021. NL = The Netherlands; NZ = New Zealand; Switz = Switzerland. The same in all subsequent figures.
These differential impacts are to some extent due to ‘geography’, as island nations such as Australia, Japan and New Zealand are better able to tighten border checks (including imposing quarantine measures) in order to stem the spread of SARS-CoV-2 than land-locked nations in Europe and North-America, but geography does not explain the observed differences completely. This is illustrated by the relatively high COVID-19 mortality rates in island nations such as Ireland and particularly the U.K. Hence, more important than ‘geography’ have been three other factors: (1) differences in public health competence; (2) variances in structural socio-economic vulnerabilities to SARS-CoV-2; and (3) the presence or absence of fiscal constraints.
The public health response
OECD governments differ considerably in the level of public-health competence with which they have responded to SARS-CoV-2. For instance, according to the Lancet Commission on ‘Public Policy and Health in the Trump Era’, around 200,000 fewer Americans would have died from the coronavirus if the U.S. had treated SARS-CoV-2 with the same level of public health competence that its peer developed nations have demonstrated. As the Lancet Commission concludes:
“Many of the cases and deaths were avoidable. Instead of galvanizing the US populace to fight the pandemic, President Trump publicly dismissed its threat (despite privately acknowledging it), discouraged action as infection spread, and eschewed international cooperation. His refusal to develop a national strategy worsened shortages of personal protective equipment and diagnostic tests. President Trump politicized mask-wearing and school re-openings and convened indoor events attended by thousands, where masks were discouraged and physical distancing was impossible.”
(Woolhandler et al. 2021, p. 711).
The scatterplot of Figure 2 throws more light on the issue. On the horizontal axis, I measure the difference between additional public spending on COVID-19 relief of each country (as a percentage of GDP and up to January 2021) and the unweighted panel-average of additional relief spending for the 22 OECD countries (which is 7.2% of GDP). On the vertical axis, I measure the difference between COVID-19 deaths per 100,000 population in each country and the (unweighted) panel-average COVID-19 mortality rate, which is equal to 86 deaths per 100,000 population.
There exists a statistically significant negative relation between additional public spending and COVID-19 mortality rates. For example, countries such as Germany, Canada, Japan, and New Zealand, which could and did raise spending on COVID-19 relief by more than the average, experienced below-average death rates. Conversely, more fiscally-constrained countries such as France, Italy, Portugal, and Spain, which could not increase additional spending to the same extent, experienced above-average death rates.
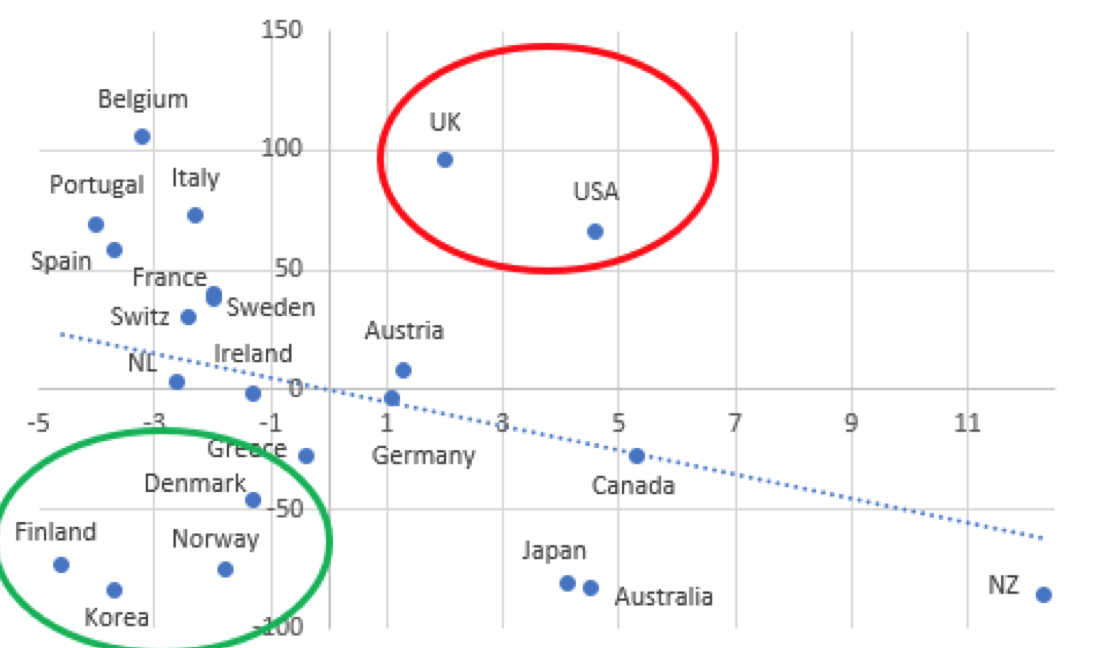
Figure 2 Scatterplot of additional public spending versus cumulative confirmed COVID-19 deaths per 100,000 population Sources: See Storm (2021b). Notes: (1) average additional public spending (as percentage of GDP) is 7.2% for the panel of 22 OECD countries; the figure reports country-wise deviations from this average; (2) the unweighted average cumulative confirmed COVID-19 mortality is 86.4 deaths per 100,000 population for the panel of 22 OECD economies; the figure reports deviations from this average. (3) the estimated linear relationship is negative and statistically significant at 2.5% (when I exclude the observations for the U.K. and the U.S. from the regression).
Of interest are those countries which are located far off the regression line. One group, including Denmark, Finland, Norway, and South Korea, experienced significantly below-average COVID-19 mortality while incurring below-average additional spending on relief measures. These countries appear to have managed the health emergency comparatively well (so far) in terms of both public health and public finances (focussing on ‘crushing the curve’ rather than ‘flattening the curve’). The same cannot be said for the other group which includes the U.K. and the U.S. Both Anglo-Saxon economies experienced significantly above-average COVID-19 death rates, despite incurring considerable above-average additional relief expenditures. The Johnson government and the Trump administration thus stand out for their expensive mismanagement of the public health emergency – both in terms of lives and taxpayers’ costs (Marmot et al. 2020b; Woolhandler et al. 2021).
Figure 3 underscores this conclusion. I plot the (negative) change in real GDP during 2019-2020 for each of the 22 OECD countries against COVID-19 deaths per 100,000 population in each country. The chart can be read as a rough representation of how well each country has protected the health of its citizens versus the macroeconomic cost of doing so. There is a clear and statistically significant negative correlation between the depth of the recession and the average number of COVID-19 deaths. The U.K., Spain, Italy, Portugal, and France all suffered excess mortality and above-average slumps in real GDP, whereas Denmark, Finland, Norway, and also Germany experienced below-average mortality and below-average recessions. The U.K. is probably the clearest example of how a country can end up in the worst possible outcome due to a half-baked, reactive, and politicized policy response. It follows that there is no inescapable trade-off between ‘saving the economy’ versus ‘saving the people,’ because outcomes depend on the quality and the consistency of public health interventions and of macroeconomic management.
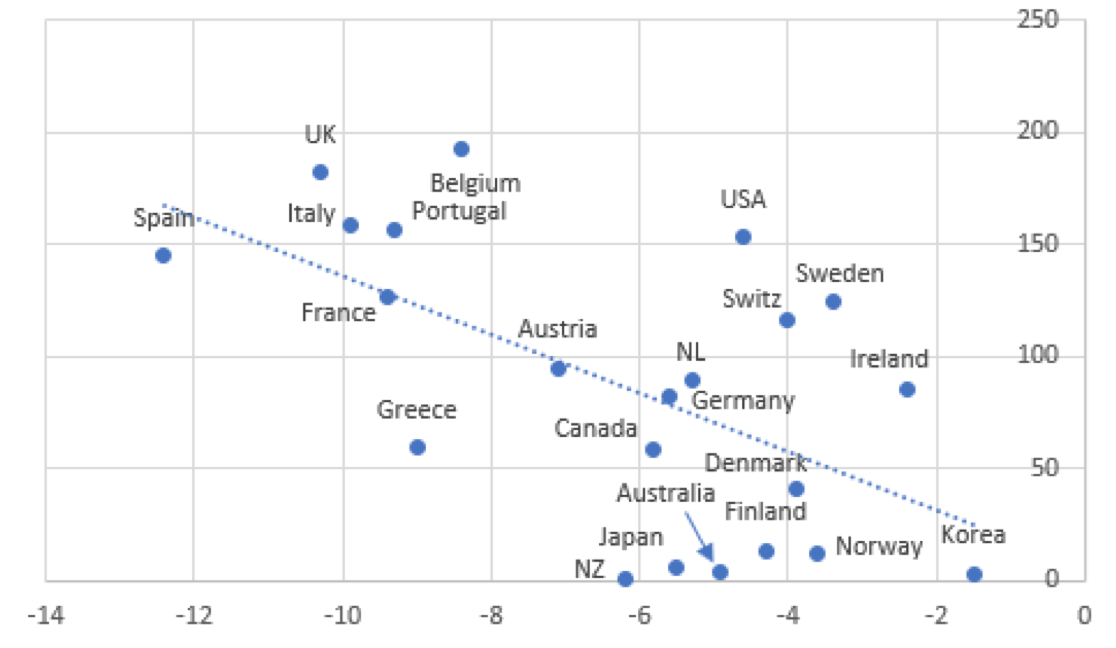
Figure 3
Scatterplot of change in real GDP during 2019-2020 versus
cumulative confirmed COVID-19 deaths per 100,000 population
 Sources: See Storm (2021b). Notes: (1) the (unweighted) average decline in real GDP for the panel of 22 OECD economies is 6.2%; the figure reports country-wise deviations from this average; (2) the unweighted average cumulative confirmed COVID-19 mortality is 86.4 deaths per 100,000 population for the panel of 22 OECD economies. (3) the estimated linear relationship is negative and statistically significant at 1%.
Structural differences in socio-economic vulnerabilities
The disturbing truth is that the excessive COVID-19 deaths in the U.K. and the U.S. occurred despite considerable relief spending, because of deep and long-standing flaws in British and American economic, health, and social policies. These structural flaws were evident, well before SARS-CoV-2 arrived, in stagnating longevity (Woolhandler et al. 2021) — and also in the chronically widening gaps in mortality across social classes, ethnic groups, and geography. The health emergency is reinforcing these long-standing economic and health inequities, often driven by racial disparities in housing, income and wealth, employment, and social and political rights. In the U.S. COVID-19 deaths, hospitalizations and cases have disproportionately affected Black, Latino and Indigenous people, who carry a greater burden of chronic diseases from living in disinvested communities with poor food options and poisoned air quality and have less access to health care. Since the 1980s, the Lancet Commission details, “the disparity between social and economic classes has widened” as unions were crushed, automation and globalization destructed high-paying jobs by fissuring the workplace, and tax while social policies have “increasingly favored the wealthy” (Woolhandler et al. 2021, p. 707) “The suffering and dislocation inflicted by COVID-19,” the Lancet Commission sums up, “has exposed the frailty of the U.S. social and medical order.”
Figure 4 presents evidence on the association between socio-economic inequality and COVID-19 deaths for the panel of 22 OECD countries. On the horizontal axis, I measure the difference between the Gini coefficient of (after-tax-and-transfer) income distribution of each country and the panel-average Gini coefficient. On the vertical axis, I measure the difference between COVID-19 deaths per 100,000 population in each country and the panel-average COVID-19 mortality rate. The U.S. and the U.K. find themselves in the upper-right quadrant of the graph, which means that they have above-average income inequality as well as above-average COVID-19 mortality. Likewise, Spain, Portugal, and Italy are clear cases of above-average inequality and above-average mortality.
Countries including Denmark, Norway, Finland, and also Germany are located in the lower-left quadrant, as they feature below-average income inequality and below-average COVID-19 mortality. Australia, Canada, Japan, and Greece recorded below-average corona-mortality but have above-average income inequality. Belgium is an outlier in Figure 4, having low inequality but the highest COVID-19 mortality; the reason for Belgium’s exceptionalism may lie in the fact that Belgian public health authorities are reporting not only confirmed cases (which are mostly hospital deaths) but also suspected cases (such as deaths in the community, especially in care homes). We must therefore keep in mind that Belgium’s (arguably more realistic) recorded death rate is not strictly comparable to death rates recorded in the other countries in the panel.
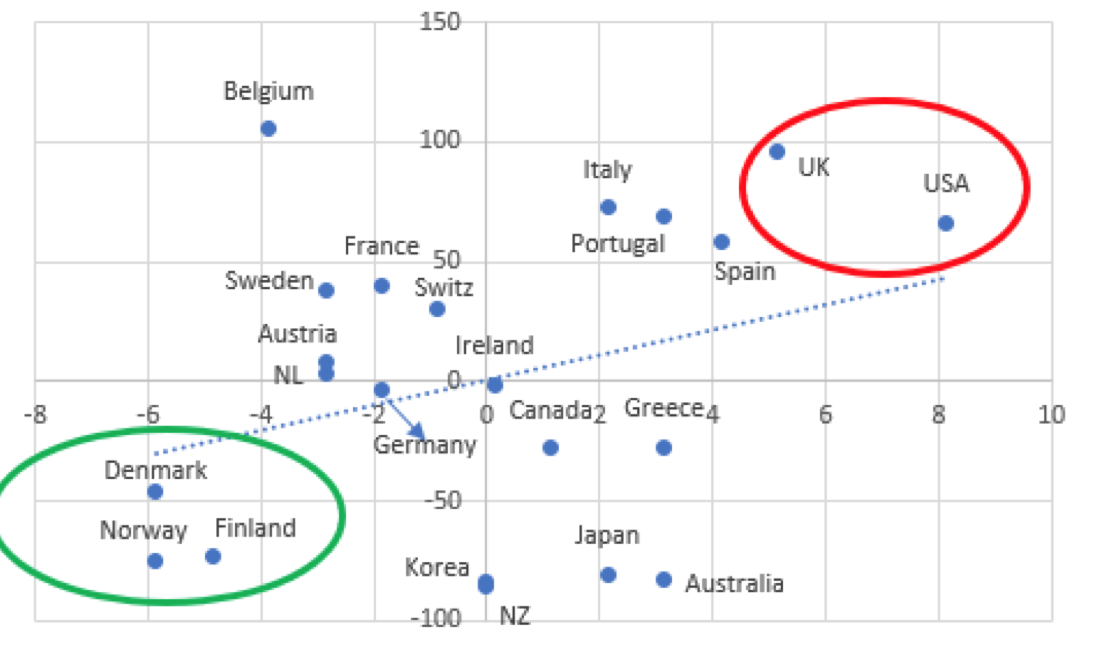
Figure 4 Scatterplot of (after-tax-and-transfer) inequality (Gini) versus cumulative confirmed COVID-19 deaths per 100,000 population Sources: See Storm (2021b). Notes: (1) the average (after-tax-and-transfer) Gini coefficient for the panel of 22 OECD economies is 30.9; the figure reports country-wise deviations from this average; (2) the unweighted average cumulative confirmed COVID-19 mortality is 86.4 deaths per 100,000 population; the figure reports deviations from this average. (3) the estimated linear relationship is positive and statistically significant at 2.5% (when I exclude the observations for Belgium from the regression).
Fiscal constraints
Cumulative public relief spending to cushion the negative impacts of the health emergency for households and vulnerable businesses (recorded until January 2021) varies €815 per person in Spain and €5490 per capita in Australia (see Figure 5). Average cumulative relief spending is €2778 for the 22 OECD economies in the panel. On a per-capita basis, Germany and Finland did spend more than 5 times as much on COVID-19 relief than Greece and Spain, and more than 2½ as much as Italy. Differences in per-capita relief spending are not always due to fiscal constraints, as is shown by Denmark, Korea, and New Zealand which all have below-average per-person relief funding in combination with relatively low COVID-19 death rates.
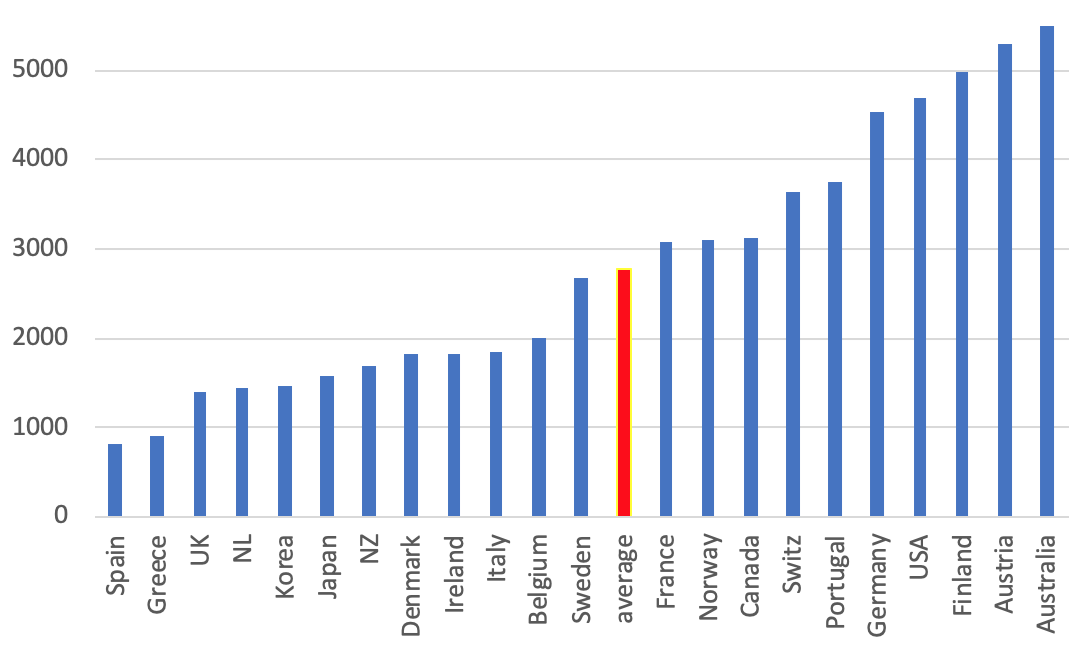
Figure 5 Additional public spending on COVID-19 relief (in euro’s & until January 2021) Sources: See Storm (2021b).
But in countries such as France, Spain, and Italy, where per-capita spending was relatively low and COVID-19 mortality relatively high, the fiscal capacity of government to raise spending to cushion the economic impact of the health emergency was compromised – because these (already highly-indebted) governments had limited access to financial (bond) markets and no national lender-of-last-resort. (This is documented in more detail in the Working Paper).
Figure 6, finally, shows that the level of per-person public COVID relief spending matters for the public health outcome. Figure 6 plots cumulative per capita public relief spending (in euros) against cumulative confirmed COVID-19 deaths (per 100,000 population). The estimated linear relationship has a statistically significant negative slope: the higher the per-person relief, the lower the corona death rate. The U.S. is, again, a worrying outlier, combining the 2nd highest per capita relief spending and the 5th highest COVID-19 death rate.
A closer look at Figure 6 reveals that six more countries – Korea, Finland, Norway, Japan, Australia, and New Zealand – do not fit the negative relation between spending and mortality. Korea, Finland, Norway, and Japan succeeded in containing COVID-19 deaths at low levels of per capita relief spending; Australia and New Zealand managed to protect public health as well, but with much higher levels of public spending (comparable to that of the U.S.) This reinforces the conclusion that the ‘quality’ of the public intervention matters and pro-active and consistent public health responses do contain health impacts at manageable costs.
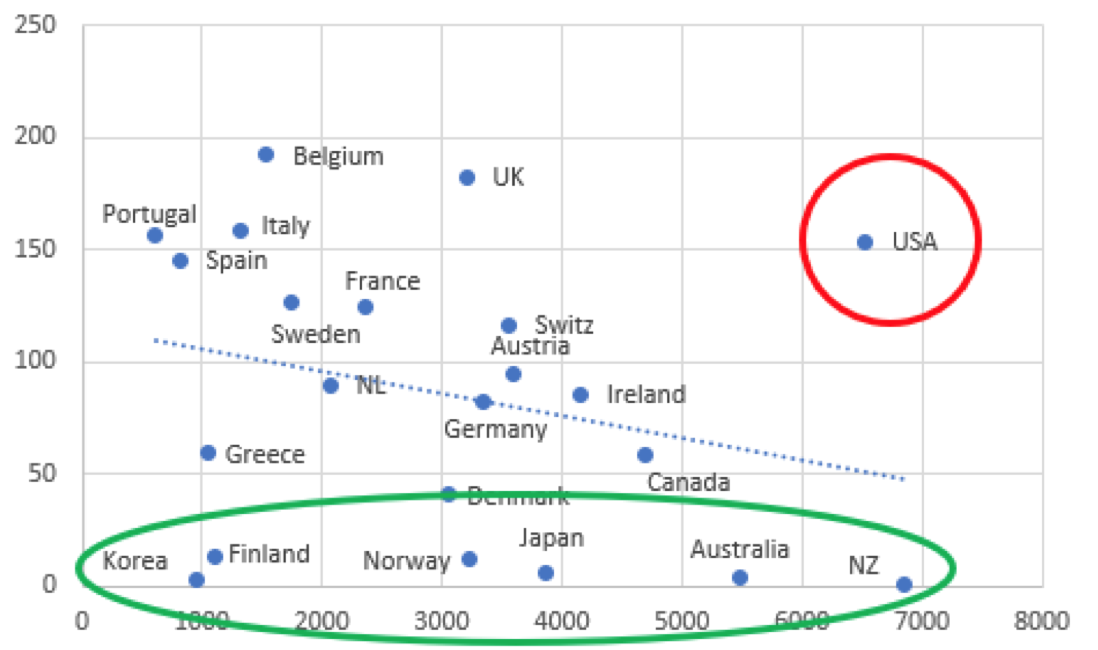
Figure 6 Scatterplot of additional pubic spending on COVID-19 relief (euros per person) versus cumulative confirmed COVID-19 deaths per 100,000 population Sources: See Storm (2021b). Note: the estimated linear relationship is negative and statistically significant at 2.5% (when I exclude the observations for the U.S.A. from the regression).
Lessons for the age of consequences
Now, with vaccines coming on stream, there is talk of getting back to ‘normal’. But the ‘normal’ that existed in February 2020 and before is neither normal nor acceptable. We must build a healthier, more resilient, and therefore more equal society. This will be possible only if macroeconomists learn from their past mistakes and change – from being part of the problem to contributing to the solution. Here follow macro’s main failings in a nutshell.
1. A deadly emphasis on fiscal austerity, consisting of a dogmatic balanced-budget conservatism, used to justify decades of underinvestment in public health infrastructure (including disease prevention and health promotion) and social protection. Austerity weakened economies and governments, increased social and political fragmentation, and, by aggravating economic and health inequalities, made populations significantly more vulnerable to the corona-virus – as has been clinically documented for England by the Marmot Commission (Marmot et al. 2020a, 2020b), and for the U.S. by the Lancet Commission (Woolhandler et al. 2021).
2. A foolish belief that redistributive policies will harm economic growth, which explains the stubborn unwillingness to reverse or reduce the social, economic, and health disparities that have left the underprivileged in society so profoundly unprotected. The belief in this trade-off has had toxic effects, but most ‘serious’ macroeconomists stubbornly uphold it, quite in line with Friedrich Nietzsche’s aphorism that “a bad conscience is easier to cope with than a bad reputation.” In the Working Paper, I show that more unequal economies suffered a deeper recession due to the COVID-19 health emergency and that more egalitarian countries were more ‘efficient,’ in terms of macroeconomic costs, in responding to the emergency. For example, the relatively inegalitarian U.S. suffered 70 COVID-19-deaths more (per 100,000 population) than more egalitarian Germany, while spending almost double the amount of money on COVID-19 relief (percent of GDP) than Germany. This conclusion holds true for public health impacts as well: as shown in Figure 4, SARS-CoV-2 mortality rates are significantly higher in more unequal societies.
3. A Uriah Heepish obsequiousness to the supposedly superior rationality of functionless financial speculators, which is allowing the rentier class to have its cake and eat it. In response to the SARS-CoV-2 health emergency, central banks have doubled down on unconditionally backstopping private financial markets, out of fear for financial instability and lacking any other courses of action. But central banks’ actions to contain financial panics by providing liquidity and backstops have had the perverse effect of turning financial markets into a state of ‘perpetual mania’ (Palma 2020). Central banks are bailing out global finance, while governments are in no position to reform it. The SARS-CoV-2 health emergency has thus accentuated as never before the oppressive power of – what Keynes (1936, p. 376) called – ‘functionless financial investors’ over central bankers, treasury officials, politicians, and the real economy. This rentier capitalism is, quite directly, to blame for the economic stagnation and the widening socioeconomic and health inequalities which increased the deadly vulnerability of large groups in our economies to infection with SARS-CoV-2 (as argued in the Working Paper).
4. A deep-rooted aversion to raising taxes, fuelled by the Reagan-Thatcher-inspired (“there is no such thing as society”) de-legitimization of the state’s role in financing critical social, economic, and health expenditures.
Taxes are indispensable not just for reasons of microeconomic redistribution, but even more strongly to put a curb on the extreme liquidity preference of the functionless investors. Combined with higher real wages (Taylor 2020) and more countervailing power for workers (Stansbury and Summers 2020), this redistribution is needed to revive aggregate demand and to remove the stranglehold of the super-rich and the big corporations on monetary and fiscal policy-making.
Such was the ‘conventional wisdom’ in macroeconomics that, for decades, mainstream macroeconomics acted as “the influential and invaluable ally of those whose exercise of power depends on an acquiescent public” (Galbraith 1973), legitimizing misguided macro policies and neutralizing any suspicion that there might exist feasible alternatives.
To solve this crisis of a corrupted collective imagination, macroeconomics must be reformed – by ditching its ideological blinders which prevent it from understanding that inequality, income distribution and demand matter for growth, in the short and in the long run; that there is no such thing as an inescapable equality-efficiency trade-off; that government spending on health and social protection is not a ‘cost’, but is critical to maintain social stability and to strengthen societal and individual resilience to deadly pathogens; that extreme inequality is economically wasteful, socially destructive and politically dangerous; that our current financial system is cannibalizing our real economy; that instead of letting irrational and greedy functionless financial investors ‘discipline’ governments we must bring the financial system under democratic control and abolish socially wasteful financial speculation; that the extreme liquidity preference of functionless investors is our biggest social and economic problem and has to be quashed; that we must urgently and radically get ‘money’ out of our political systems, because it is a big distortion; that government budgets don’t need to be balanced; and that redistributive taxation is critical, not just to invest in social overhead services that enhance labour productivity, lower the reproduction costs of labour, and thereby increase the rate of profit, but more importantly to re-allocate income and demand, away from speculative finance and toward investment in productive capabilities, social protection, education, public health and other socially useful activities.
References
Galbraith, J.K. 1973. ‘Power and the Useful Economist.’ American Economic Review 63 (1): 1-11.
IMF. 2020. Fiscal Monitor: Policies for the Recovery. October. Washington, DC: IMF.
IMF. 2021. Fiscal Monitor Update: January 2021. Washington, DC: IMF.
Keynes, J.M. 1936. The General Theory of Employment, Interest and Money. London: Macmillan.
Marmot, M. et al. 2020a. Health Equity in England: The Marmot Review Ten Years On. Institute of Health Equity.
Marmot, M. et al. 2020b. Build Back Fairer: The COVID-19 Marmot Review. The Pandemic, Socioeconomic and Health Inequalities in England. Institute of Health Equity.
Palma, J.G. 2020. ‘Finance as perpetual orgy: How the ‘new alchemists’ twisted Kindleberger’s cycle of “manias, panics and crashes” into “manias, panics, and renewed manias”.’ Cambridge Working Paper in Economics 2094. University of Cambridge: Faculty of Economics.
Storm, S. 2017. ‘The new normal: Demand, secular stagnation, and the vanishing middle class.’ International Journal of Political Economy, 46(4), 169-210;
https://www.tandfonline.com/do…
Storm, S. 2018 ‘Financialization and economic development: A debate on the social efficiency of modern finance.’ Development and Change, 49(2), 302–329.
Storm, S. 2021a. ‘Cordon of conformity: why DSGE models are not the future of macroeconomics.’ Institute for New Economic Thinking Working Paper No. 148, https://www.ineteconomics.org/…
Storm, S. 2021b. ‘Lessons for the age of consequences: COVID-19 and the macroeconomy.’ Institute for New Economic Thinking Working Paper 152, New York: Institute for New Economic Thinking.
Stansbury, A. and L.H. Summers. 2020. ‘The declining worker power hypothesis: An explanation for the recent evolution of the American economy.’ NBER Working Paper 27193. Cambridge, MA: National Bureau of Economic Research.
Taylor, L. (with Ö. Ömer). 2020. Macroeconomic Inequality from Reagan to Trump. Market Power, Wage Repression, Asset Price Inflation, and Industrial Decline. Cambridge University Press.
Woolhandler, S. et al. 2021. ‘Public policy and health in the Trump era.’ The Lancet 397 (10275): P705-753, February.