Economic, social and health decline in the industrial Midwest may have been a major factor in the 2016 US presidential election, Monnat and Brown’s INET research finds, with people living in distressed areas swinging behind Trump in greater numbers. Trump performed well within these landscapes of despair – places that have borne the brunt of declines in manufacturing, mining, and related industries since the 1970s and are now struggling with opioids, disability, poor health, and family problems.
The role of the rural vote in Donald Trump’s victory in the U.S. Presidential election has received widespread coverage. But suggesting that rural frustration with political insiders and years of perceived neglect was in itself enough to deliver Trump to the White House overlooks other key factors that saw the Republican candidate out-perform in areas ravaged by decay.
To be sure, Donald Trump received a much larger share of the rural vote than Democratic candidate Hillary Clinton. Electoral data shows he won the countryside by 63.2 percent to 31.3 percent, with the vote share increasing in the most rural areas. But this advantage hardly signals a new trend. Republican candidates have long won larger shares of the rural vote, particularly in Appalachia, the Great Plains, and parts of the South. In addition, rural voters account for only about 15 percent of the total U.S. population, and provided a similar share of votes in the 2016 presidential election.
Although Trump’s rural edge certainly contributed to his victory, it was not sufficient to swing the election on its own or to support a theory that a “rural revolt” handed him the win. Instead, Trump’s combined rural and small city over-performance, and Clinton’s under-performance, particularly in the industrial Midwest, was key to Trump’s unanticipated victory. To understand the election outcome it is critical to understand what drove voters in those areas to cast a ballot for Trump.
Election Results: The Predicable and The Unexpected
Of course, Clinton won the U.S. popular vote by nearly 2.9 million votes. Trump not only lost the national popular vote; he also under-performed relative to Mitt Romney four years earlier, receiving 45.9 percent of votes in 2016 compared to Romney’s 47.1 percent in 2012.
Trump nonetheless won because the U.S.’ electoral college system places more importance on some states over others when it comes to the outcome. Small advantages in key places enabled Trump to accumulate sufficient electors to claim victory. Like Romney in 2012, Trump garnered large vote shares throughout Appalachia, the rural South, the Great Plains, and Mountain West.
The Republican stronghold in these areas is not new. What was unexpected though, was how well Trump performed, and conversely how poorly Hillary Clinton performed, in the industrial Midwest. Ultimately, Trump’s win came down to a difference of just 77,744 votes spread across three states: Michigan, which he took by 10,704 votes; Pennsylvania, by 44,292; and Wisconsin, with a 22,748 margin.
Trump also garnered substantially larger vote shares than Romney in the other industrial states including Ohio, Illinois and Indiana – as well as in Appalachia, parts of New England, upstate New York, Minnesota, and Iowa.
Trump won more votes than Romney in these regions; Clinton also received far fewer votes and a smaller share than Obama in these areas, even in counties and states she won.
Although the industrial Midwest is home to just over 16 percent of U.S. counties, nearly a third of the 206 pivot counties – those that went for Trump after going for Obama in both 2008 and 2012 – were in the industrial Midwest. In nearly all pivot counties, Obama’s victory margin declined between 2008 and 2012, perhaps foreshadowing their shift to a Republican candidate in 2016. Importantly, Trump’s advantage in the industrial Midwest was not confined to rural counties; it also included small urban counties like Montgomery County in Ohio and Luzerne County, Pennsylvania, and even larger urban counties like Michigan’s Macomb County, which is located in the Detroit metropolitan area.
How Despair Drove Trump Votes
To understand the electoral shift in these and similar places outside of the industrial Midwest, it is important to understand the economic, social, and health declines that have plagued them over the past three decades. In many of the rural areas and small cities where Trump performed better than expected or where Clinton performed worse than expected, economic distress had been building and social conditions breaking down for decades. The places that experienced the largest voter shifts in 2016 were not all among the poorest places in America, though Appalachia certainly holds that distinction. But they are places that are generally worse off today than they were a generation or two ago, with far fewer manufacturing and natural resource industry jobs that once provided reliable, livable wages and benefits to those without a college degree. Certainly de-industrialization is not a new phenomenon in the U.S., but its impacts have been unevenly distributed.
Our INET research, published in the Journal of Rural Studies, used county-level election data from 2012 and 2016 alongside demographic, economic, and health research from multiple sources to probe key sources of Trump’s support. We found that nationally, and especially in the industrial Midwest, Trump’s average over-performance – defined as the difference between his percentage share of the vote compared to that of Romney four years earlier – was greater in areas of higher economic, social, and health distress.
Comparing the difference in Trump over-performance between counties in the top and bottom quartiles for economic, demographic, and health characteristics helps us understand what drove voters in areas including the industrial Midwest to swing to Trump. The percentage of residents without a four-year college degree had the strongest association with Trump over-performance, but indicators of despair also helped to explain his success in the industrial Midwest. In particular, economic distress (based on rates of poverty and unemployment, and the percentage of people collecting disability payments or lacking health insurance), health distress (determined by rates of disability, obesity, those rating their own health fair or poor, smoking, and drug-induced, alcohol-induced and suicide mortality), and social distress (accounting for factors like rates of separation/divorce, single parent families, vacant housing units and persistent population loss), were strong predictors of Trump over-performance. Notably, Trump’s average over-performance was 12% higher in counties with the highest poverty rates compared to those with the lowest poverty rates. These relationships held even when controlling for metropolitan status.
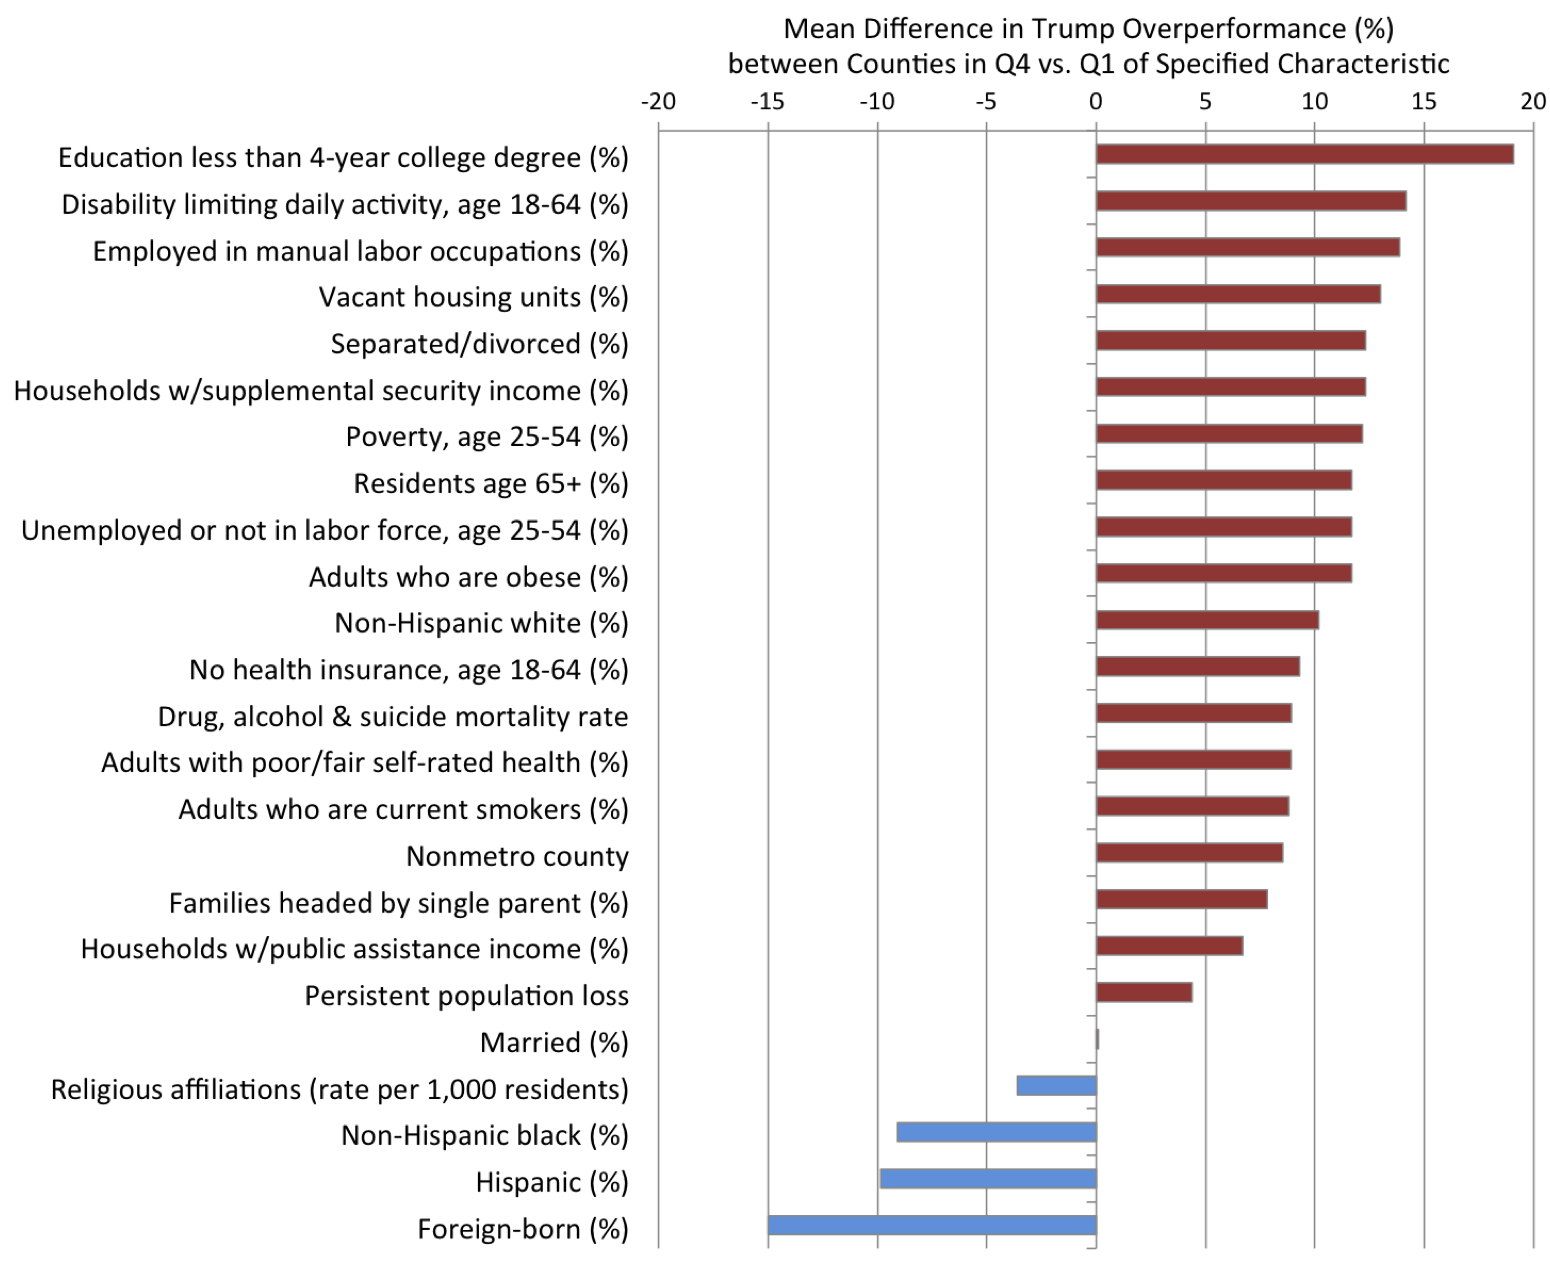
Mean Difference in Trump Over-performance (%) between Counties in the Top Quartile vs. Bottom Quartile of Each County Characteristic, Industrial Midwest N=504 counties in Industrial Midwest (Illinois, Indiana, Michigan, Ohio, Pennsylvania, and Wisconsin). The bars represent the difference in mean Trump over-performance (percent difference in Trump vote share in 2016 vs. Romney vote share in 2012) between counties in the top 25th percentile (Q4) vs. bottom 25th percentile (Q1) for all characteristics except non-metro county and persistent population loss (which are both dichotomous). All estimates are from unadjusted linear regression models, but all models use clustered standard errors to account for nesting of counties within states.
Of course, this is not an exhaustive list of factors that likely influenced the election, and many of these factors are strongly correlated, making it difficult to disentangle and rank in terms of influence. We also don’t know from the data whether the most economically distressed residents voted for Trump, or if it was comparatively less distressed residents who, out of anxiety and frustration with the deprivation they saw around them, went for the Republican nominee.
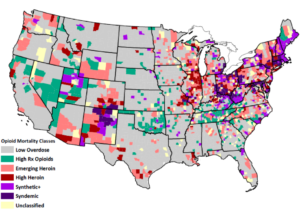
Ultimately, what these descriptive findings suggest is that Trump performed well within these landscapes of despair – places that have borne the brunt of declines in manufacturing, mining, and related industries since the 1970s and are now struggling with opioids, disability, poor health, and family problems. Just as decades of declines in secure and livable wage jobs, resource-disinvestment, and social decay have made some places in the U.S. more vulnerable to the opioid scourge, the same forces made some places more susceptible to Trump’s quick-fix populist messages.