Once again, income earned by the many is used to save the wealth of the few.
A side effect of the 2008 financial crisis was that the average taxpayer had to dig deep into her and her children’s pockets to save many financial assets. Given the uneven concentration of financial assets, this rescue mission was in fact a bailout of the rich. At the time, advocates argued that these side effects were warranted in the interest of the common good, for the sake of stabilizing and ensuring the future income of everybody in society.
Ultimately, though, private wealth was saved for the benefit of its owners. As the markets recovered in the following years, banks made tremendous profits, share values increased, and the private wealth laboriously saved by the many was again a great source of income for the few. The narrative for the many was, again, that it would be good for them to save more from their labor income and take some entrepreneurial risk in order to participate in the thriving economy. But why couldn’t they reap any of the benefits they had made possible in the first place by having rescued all these assets? Because none of the future income made possible by the joint efforts of the rescue teams was earmarked for public sharing.
A mere ten years later, the real economy has been hit by another crisis. This time the crisis is hitting private wealth in the form of private businesses. That’s why the support for the rescue policies is even larger now and the goal is clear: private wealth must be saved.
The argument is once again that there is no alternative; if we do not save the private wealth that is at stake, everybody will suffer. But ownership of private businesses is extremely concentrated. Again, income earned by the many is used to save the wealth of the few. And indeed, history repeats itself as a tragedy for the many: none of the current plans envisage increasing public wealth or reducing the concentration of private wealth.
Actually, the side effects will be even worse this time. The economy after the crisis will likely be one where market concentration is higher and power positions in society are more stable than before. As the crisis hits the poor the most and as it will increase unemployment for a longer period of time, the bargaining power of workers will be lower.
The economic discussion around whether the COVID-19 crisis will depress gross domestic product (GDP) by 5%, 10%, or 20% misses the point and deceives the general public: the problem in this crisis is that the numbers go down for the many but go up for the few. Most people do not reflect on the fact that staring at GDP numbers to measure the success of an economy implicitly means accepting that every euro or dollar of income matters the same no matter if it helps somebody to survive, or live a decent life, or if it produces just marginal changes on a bank account with many zeros. But GDP is the sum of yearly incomes. Over the last decades, a rising share of GDP has been derived from capital income. And highly concentrated private wealth has also grown much faster than GDP itself, amounting to 5 to 6 times yearly GDP by now.
The average of trees is not a forest - but likely closer to sawdust
Olivier Blanchard recently tweeted that “much of the progress in macro in the last 40 years came from the assumption of ergodicity” (25.04.2020). He argues that that is the reason why macroeconomic models “have a hard time dealing with the current data.” One description of an ergodic scenario is that the average outcome of a group is the same as the average outcome of an individual over time. But the almost religious belief in the usefulness of averages and aggregates is not only a problem of macroeconomics or GDP alone. In a different way, a similar problem materializes in microeconomic empirical research on inequality.
In the midst of this crisis, the European Central Bank (ECB) recently published the results from its 3rdwave of the Household Finance and Consumption Survey (HFCS). The HFCS is a large-scale household survey similar to the Survey of Consumer Finances and has come to be the main source for analyzing wealth inequality in continental Europe. One would expect this would be the tool of choice for making all the potential consequences of crisis policies more transparent. It would give scientists, policy makers, and the general public a better grasp of how the current policy interventions redistribute resources accumulated in the past and likely to be accumulated in the future – or, in other words, enhance understanding of who benefits to what degree. However, the crucial messages of the ECB on the development of wealth inequality remained surprisingly Delphic:
“a reduction in inequality in the lower half of the distribution and an increase in inequality in the upper half. All in all, there was a slight compression of the net wealth distribution”.
It is unclear on which inequality measures or form of analysis this statement of the ECB is based on. One actually has to read the accompanying Statistical Report to find a few nuggets of information on wealth inequality in its appendix table J4.
Table 1 shows inequality measures based on the ECB data, to which we have added comparable data for the US (Survey of Consumer Finances) and the UK (Wealth and Asset Survey). These measures tell us that the inequality of net wealth is high. It is high in all countries, but in some it is especially high: in the USA or in Cyprus, for example, but also in Austria, Germany or the Netherlands. By contrast, and somewhat surprisingly, the wealth inequality measure is rather low for the UK.

The ECB ignores cross-country comparisons and pools the data for the euro area countries instead. But pooling the data for households living in 21 different European countries boils down to merging data that carry disparate meanings of wealth. In some countries, people have to rely on their wealth for health services and retirement, while in other countries, these services are provided by the state. Thus, the absolute and relative levels of wealth must differ accordingly across countries. Private wealth plainly fulfills different functions across countries, given cross-country institutional differences from pension systems to labor markets and housing. A given wealth share will mean different things and a different kind of social reality in different countries, depending on how workers’ rights, anti-trust laws, regulatory regimes, the welfare state, and the tax system differ.
Figure 1 illustrates this phenomenon showing the highly significant correlation between public social security expenditures and the wealth share of the bottom 50%. For low-wealth households, wealth largely fulfills a contingency function. The more of this function that is provided by the state through public health insurance, unemployment insurance, state pensions, public housing and so on, the less private wealth is needed to ensure adequate insurance, pension coverage, and proper housing. After all, most people live in a kind of income world.
Figure 1: Net wealth share of bottom 50 and social security expenditure

Source: Eurosystem HFCS 2017 (Continental Europe); WAS 2014/2016 (UK); SCF 2016 (USA); OECD 2016; Eurostat 2016.
See our dashboard for more standard cross-country analysis of the new European HFCS data.
Looking at wealth through the class lenses
Different functions of wealth are key to understanding the wealth distribution. While housing is the main asset for middle class households, it is only one part of the puzzle and far from being the key to understanding overall wealth inequality.
Measuring wealth is by no means straightforward. The methods used to present the observed data structures shape how we see social reality. Household surveys are plagued with problems when it comes to measuring the wealth of the rich. The top 1% in the survey does not adequately represent the households constituting the top 1% of our societies. The use of statistical models such as the Pareto distribution cannot change the fact that we neither know who the rich are nor how rich they are. The wealth share of a statistical percentile alone does not allow for any normative interpretation.
In the following we apply an alternative approach (see Fessler and Schürz 2020). Making the power and production relations explicit in the statistical analysis of wealth inequality takes our argument forward by creating a more coherent analysis of wealth inequality. It therefore also allows us to better see how the current crisis policies affect different households differently. Socioeconomic information on the wealth holders derived from household wealth surveys allow us to reconstruct social classes. That is a great advantage over the administrative data that are often used to estimate top shares. Basically, three classes suffice to characterize the social structure of society: renters, owners, and capitalists.
These classes can be easily defined: Renters rent their homes and hold wealth mainly for precautionary reasons. Owners own their homes and use their wealth also for living, thus generating non-cash income (imputed rent) from their wealth. Capitalists not only own their homes but even rent out further real estate and/or have self-employed business wealth. For them, wealth is an important source of cash income. In other words, income and wealth are linked in different ways for different classes.
Figure 2 shows estimates for the share of renters, owners, and capitalists in the US, Germany, and the United Kingdom across the wealth distribution. The lines show class location and display the probability of a household at a certain point of the wealth distribution being a renter, an owner, or a capitalist. Renters are at the bottom, owners in the middle, and capitalists at the top of the wealth distribution. This picture does not change much if we control for education, occupation, or age; and the pattern is generally the same for all euro area countries (not shown). The country-specific findings differ due to the degree of variation in institutional settings, tax law, history, the welfare state, and so on.
The UK is an impressive example for the impact of the housing revolution. The conclusion is that there is no sense in defining ex ante specific groups based on percentiles unrelated to social realities.
Figure 2: Class location across the wealth distribution


Source: Eurosystem HFCS 2017 (Continental Europe); WAS 2014/2016 (UK); SCF 2016 (USA).
Figure 3 relates the share in gross income as well as the share in net wealth to the respective population shares of renters, owners, and capitalists. In both graphs, countries are sorted by the ratio of owners. This ratio is close to one in all countries, which means that a group’s share in income and wealth is very close to its population share.
We see that wealth inequality in society is a function of the differences between renters and capitalists. The world of homeowners is rather equal and close to overall means, whereas inequality is driven by differences between renters and capitalists. However, a policy approach aiming at a society of homeowners is misguided.
Figure 3: Class shares of income and wealth in relation to population shares


Source: Eurosystem HFCS 2017 (Continental Europe); WAS 2014/2016 (UK); SCF 2016 (USA).
Figure 4 presents disaggregated wealth-to-income ratios for Europe. Class variation is far more important than country variation. People within classes are more similar than people within countries. Thus, when looking for justifications of wealth inequality, we should shift our focus away from country comparisons to social classes instead. Furthermore, wealth-to-income ratios give us an idea of the importance of inheritances within social classes, which make them a proxy for the stability of class membership and class location over generations. It is a major function of wealth to serve as a resource of consumption in precarious times with little income.
Figure 4: Wealth to income ratios of renters, owners and capitalists
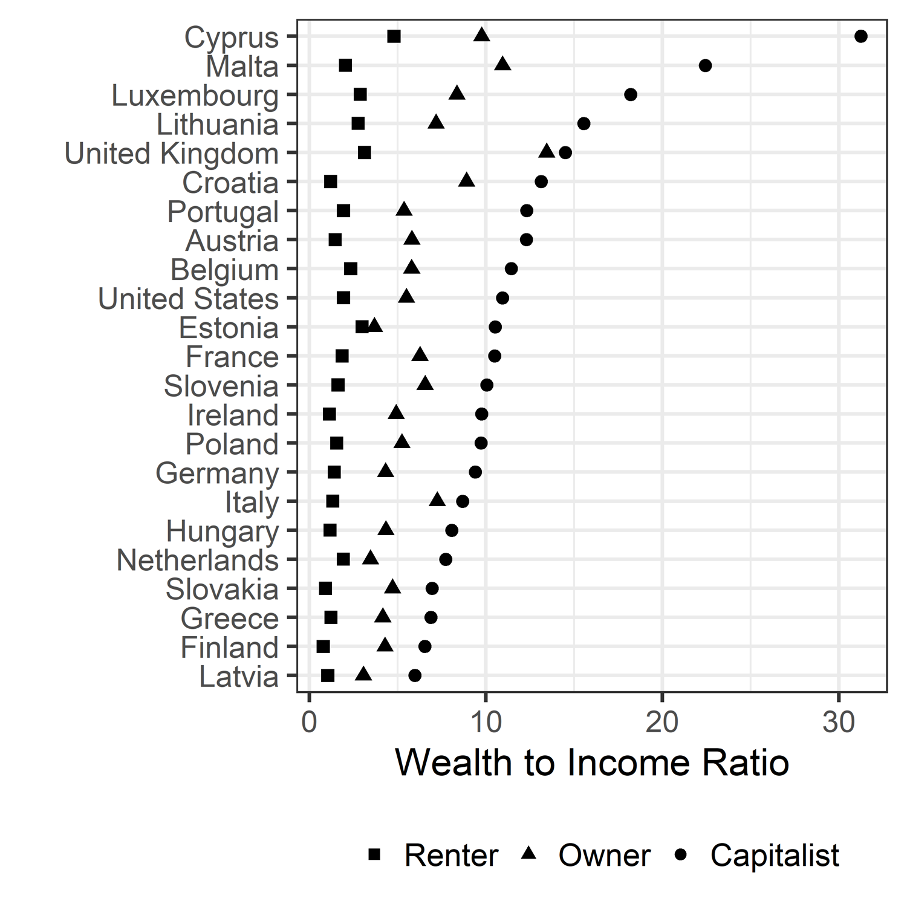
Source: Eurosystem HFCS 2017 (Continental Europe); WAS 2014/2016 (UK); SCF 2016 (USA).
Renters are crucially dependent on selling their labor, since they do not have cash-income from capital while having to pay rent. Figure 5 speaks directly to this important social relation in society. It answers the question of how many typically priced years of labor a capitalist, who has relevant cash income from wealth, can buy from a renter, who relies completely on labor income and does not have relevant cash (income from renting out real estate or self-employed business) or non-cash (owner occupation) income.
Figure 5: Capitalists’ mean (median) wealth in years of renters’ mean (median) income

Source: Eurosystem HFCS 2017 (Continental Europe); WAS 2014/2016 (UK); SCF 2016 (USA).
Perspectives matter
The measurement of wealth influences how people think about the distribution of wealth and its relevance in society. In the COVID-19 crisis, it is becoming clear once more why distinguishing between the different functions of wealth is so important.
If we measure wealth inequality by the Gini coefficient, people will understand the dramatic differences in quality of life and will continue to think along the line of country comparisons. If we measure wealth along class lines rather than percentiles we see more clearly: divided we stand. It is impossible to arrive at a rational justification of wealth inequality as there is no “we” when it comes to private wealth. The broad “whatever it takes” commitment underlying COVID-19 programs across the world seems to provide answers for all different kinds of needs in crisis. However, this approach hides the massive distributional impact.
Saving every private business without becoming an owner or at least gaining some entitlement to future profits boils down to saving the wealth of the rich – the capitalists. Governments, which are highly influenced by the wealthy, use the money of the many to save the wealth of their donors (see Ferguson, Jorgenson and Chen 2018). Subsidizing income of the poor for a few months is not comparable to using the income of all to secure the wealth of the few. Especially because this wealth is income generating and linked to power. The public rescue programs related to the coronavirus underline even further the necessity of a rigid wealth versus income distinction (see Jake Johnson’s recent article)
Both GDP and wealth have increased strongly in the last decades, but private wealth has grown much faster than income, as evidenced by the strong rise in wealth-to-income ratios in the last 50 years. The decisive question is: How can it be that, after just a few weeks of income losses, large parts of the population face fears of being unable to keep servicing their debt, paying their rent, or even buying food? How can it be that we have no system in place that allows people to just live on without selling their labor power if they cannot? Any government should be measured against benchmarks such as ensuring that nobody is worse off in real terms than a median household in the mid-nineteen nineties. Keeping the focus on the average means keeping the focus on those who are well off – with or without crisis.
The virus does not make us all equal. There is a vast difference between having one’s wealth protected and getting a small, temporary income transfer. There is a huge difference between rescuing shareholders or enterprises or people, between saving wealth and saving income. The so-called “side effects” should, in fact, be the main concern of policymaking in this crisis.
Literature
Ferguson, Thomas, Paul Jorgensen, and Jie Chen (2018): “Industrial Structure and Party Competition in an Age of Hunger Games: Donald Trump and the 2018 Presidential Election,” Institute for New Economic Thinking Working Paper No. 66, https://dx.doi.org/10.2139/ssr…
Fessler, Pirmin and Martin Schürz (2020): Structuring the Analysis of Wealth Inequality using the Functions of Wealth: A Class-Based Approach, NBER Chapters, in: Measuring and Understanding the Distribution and Intra/Inter-Generational Mobility of Income and Wealth, National Bureau of Economic Research, Inc., forthcoming. https://www.nber.org/chapters/…