The “War on Poverty,” and the impact of public policy
In his first State of the Union address in January 1964, President Lyndon B. Johnson told Congress that “many Americans live on the outskirts of hope—some because of their poverty, and some because of their color, and all too many because of both.” Johnson declared “unconditional war on poverty in America” and challenged Congress to act on income, jobs, health, education, and housing.
Johnson’s call was propelled by the civil rights movement and its dual struggle for equal political rights and tangible economic justice for all. After all, the name of 1963’s March on Washington was “The March on Washington for Jobs and Freedom,” which included in its demands “a massive federal program” for all unemployed workers—black and white—and a minimum wage that “will give all Americans a decent standard of living.”
In 1967-8 Dr. Martin Luther King Jr. prophetically urged America, as his friend, the late Vincent Harding, described:
”—in word and deed—to break out of our destructive triple bondage to racism, materialism, and militarism.”
Dr. King organized a Poor People’s Campaign and March on Washington with the Southern Christian Leadership Conference in 1968 which was carried out and led by Ralph Abernathy in the wake of King’s assassination.
We are now fifty years from the enactment of various anti-poverty programs, and at first glance, the numbers are discouraging. The poverty rate fell by almost half from its peak of 26 percent in 1967 to 13 percent in 1980. But since then, there has been little substantive decline, with 13.5 percent of the U.S. population in poverty in 2015.
Some critics claim that although programs may have been well-meaning, they have failed. Others go further, saying poverty is overstated because official measures do not count the cash value of benefits. And some even argue poverty is less pernicious because most poor households have basic necessities of a decent life, like air conditioning, television, or mobile phones.
Like the critics, this report shows that poverty rates are stubborn, and have not declined as much as the 1960s reformers hoped. But unlike the critics, it shows that adding in net benefits does not result in significantly lower poverty rates. And although black Americans suffer the most commonly, poverty cuts across race—in 2015, almost 18 million white Americans, 12.2 million Hispanics, over two million Asians, and 9.6 million black people lived in poverty.
But this report also documents that without government programs, tens of millions of Americans would be in poverty. This is especially important because of economic and income stagnation. Inflation-adjusted wages and income for the vast majority of Americans peaked in 1999, the real value of the minimum wage peaked in 1968, and income inequality has shot to levels not seen since the “Roaring ‘20s,” with the top one percent of Americans capturing over 90 percent of all income gains since the Great Recession ended.
Given these economic problems, it is perhaps surprising that more Americans have not fallen into poverty. This report looks mostly at direct relationships between economic factors and poverty. A deeper analysis of poverty, would analyze inequality and the intertwining of low incomes, stagnant economic growth, subpar education, inadequate housing and health care, and a harsh and discriminatory criminal justice system. For now, it is enough to note not only the gaps that remain to fulfill America’s promise for all, but also the critical role that existing programs play in keeping poverty from being even more extreme.
Key Points
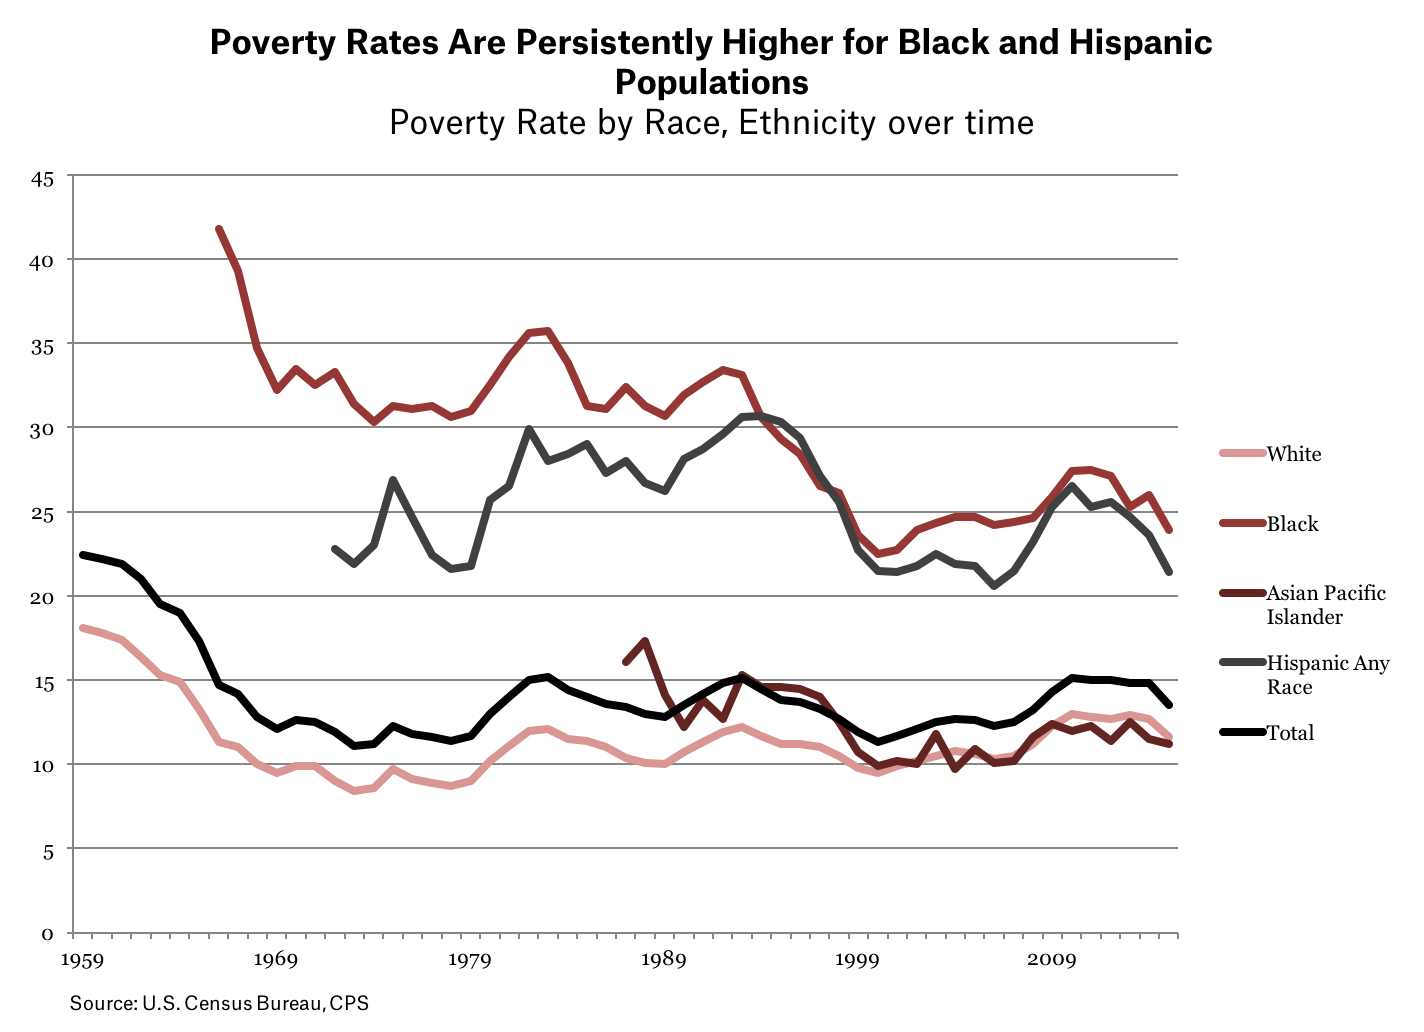
Though poverty is a problem across the U.S., poverty rates are persistently higher for black and Hispanic communities.
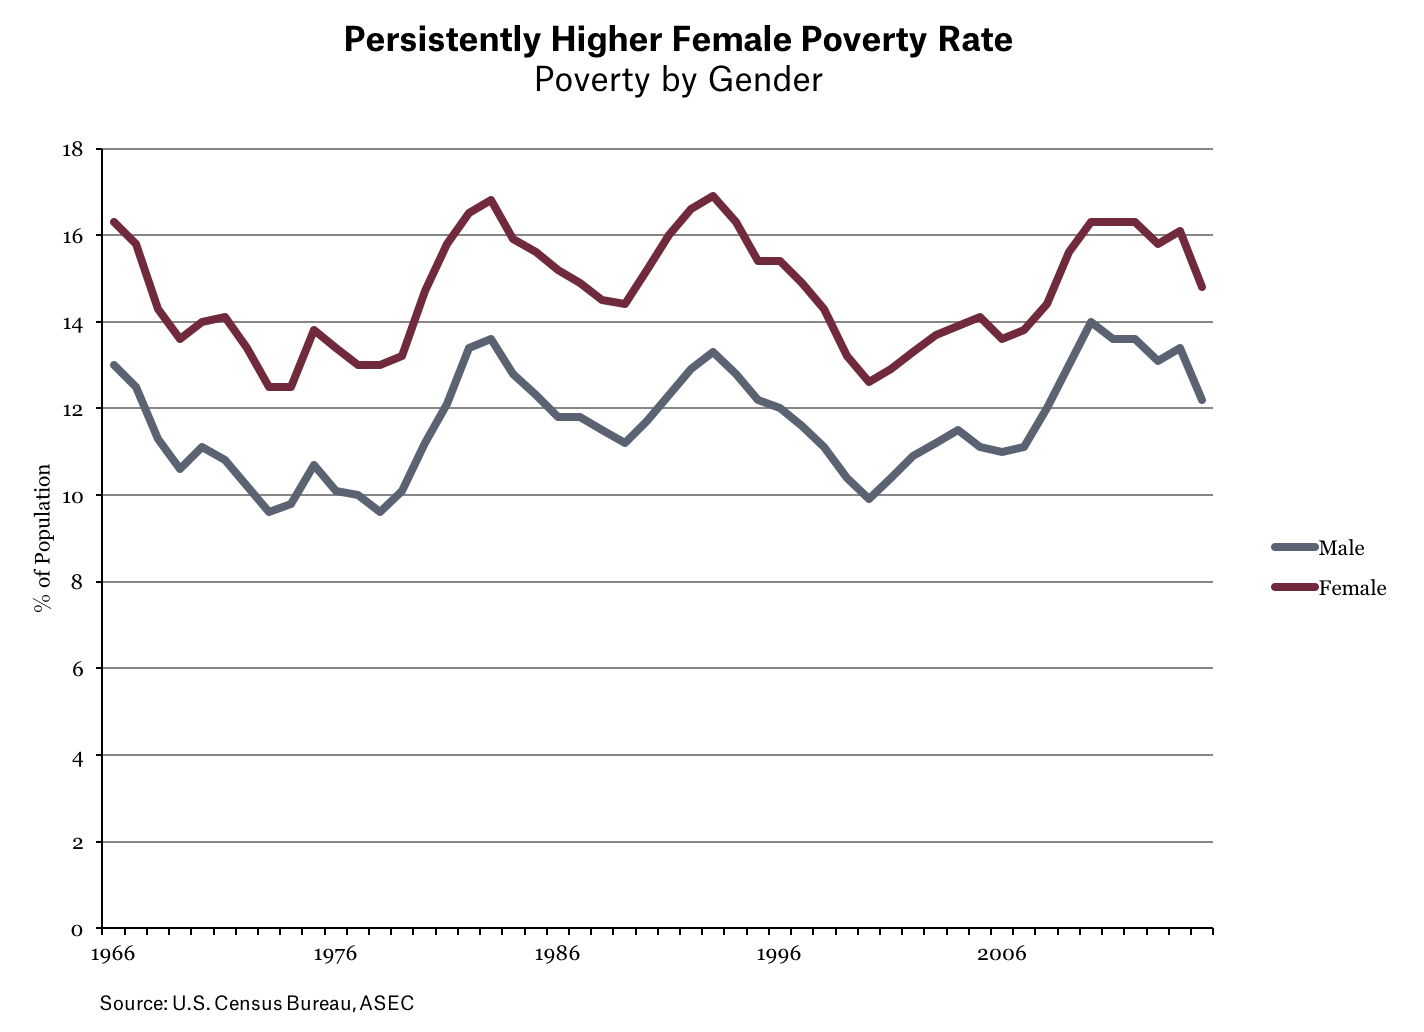
- Women and children also face persistently higher rates of poverty.
- Income security spending by the government makes up only 0.4 percent of GDP.
- Though a small portion of government spending, economic support programs keep millions of Americans out of poverty.
- Growing inequality in income and wealth contribute to persistent poverty.
Trends in Poverty
During the early years of the War on Poverty, the overall poverty rate dropped sharply, through a combination of economic growth and increasing social spending. But in the mid-1970s, the rate flattened out, and has not moved much since then.
Mirroring economic inequality and discrimination, poverty rates among black and Hispanic communities remain the highest among all racial groups, although early social spending (including Social Security) brought down poverty for all groups. Black poverty in particular dropped sharply in the 1960s and again in the 1990s, while still remaining the highest among racial and ethnic groups.
Poverty for women also is higher than for men, mainly because women have worse labor market opportunities in terms of wages, hours, and occupations. In 1966, poverty was 33 percent higher for women than for men; the gap fell to 26 percent in 2015, but it remains large and persistent.
The greatest progress against poverty has come among older Americans over 65, through improvements in Social Security. Meanwhile, child poverty has trended higher since the late 1970s.

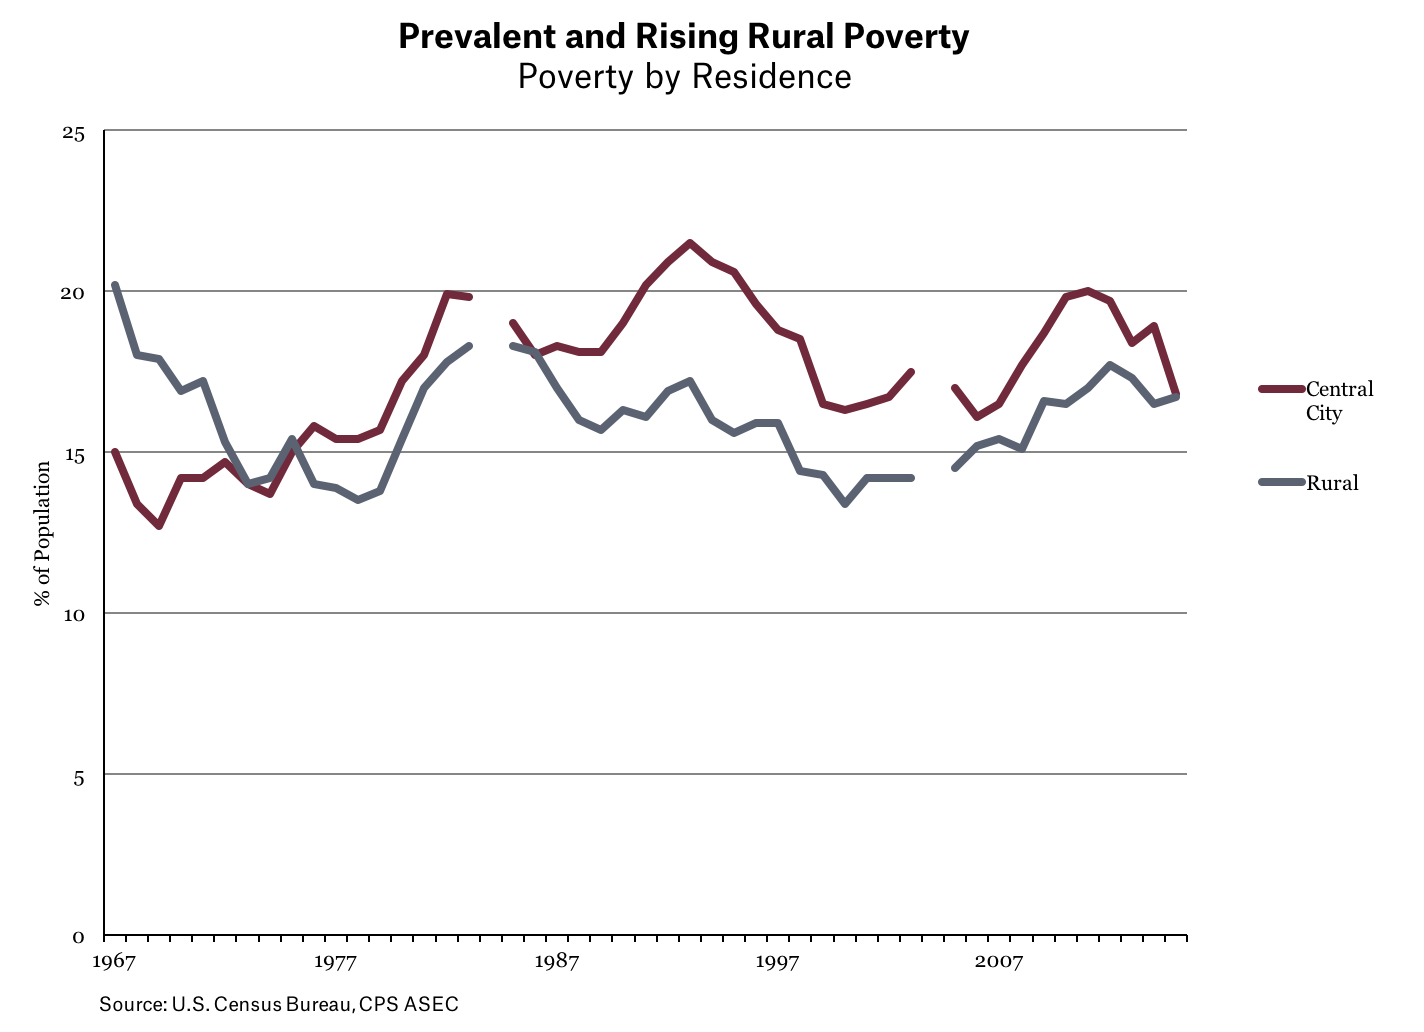
And although poverty often is thought of as an urban problem, rural America also has high poverty rates, close to that of central cities.
Spending on Poverty
Although some critics argue that anti-poverty spending has skyrocketed, the long-term trend of federal spending on low-income people (not including health care) is stable when measured as a percentage of the total economy. Discretionary program spending did rise during the Great Recession but is falling back towards its long-term trend of two percent of GDP.
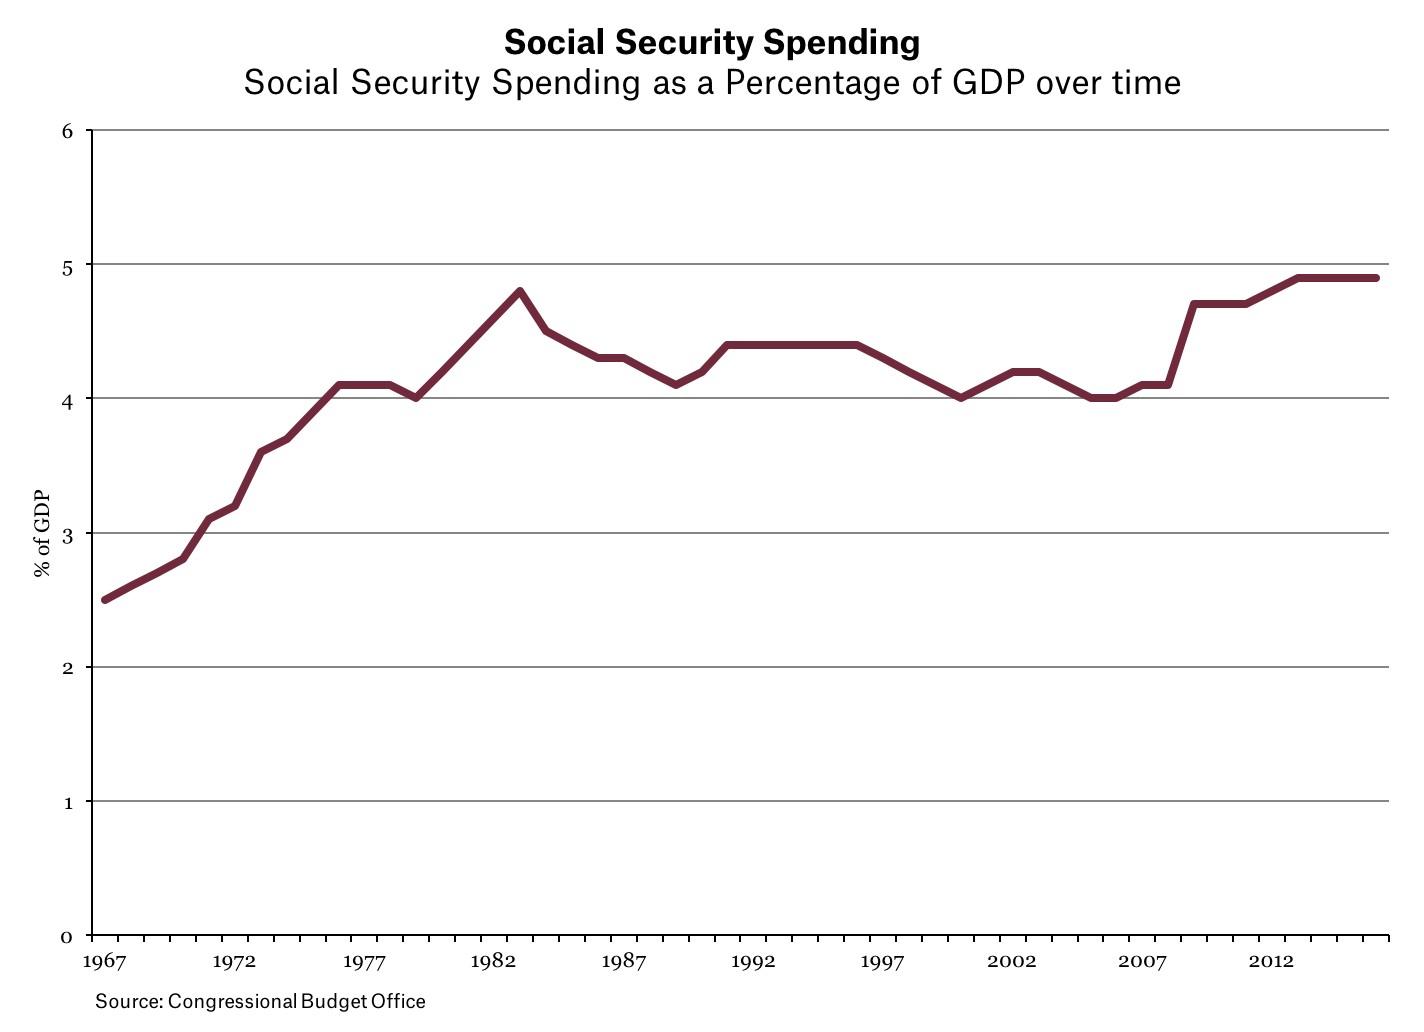
As noted earlier, the single most effective government program fighting poverty has been Social Security. Spending rose in the 1960s and again in the 1970s, sharply reducing poverty rates among the elderly, which fell from 35 percent in 1960 to 10 percent in 2014. Social Security spending for the non-elderly reduced that group’s poverty by 8.5 percent in 2012.
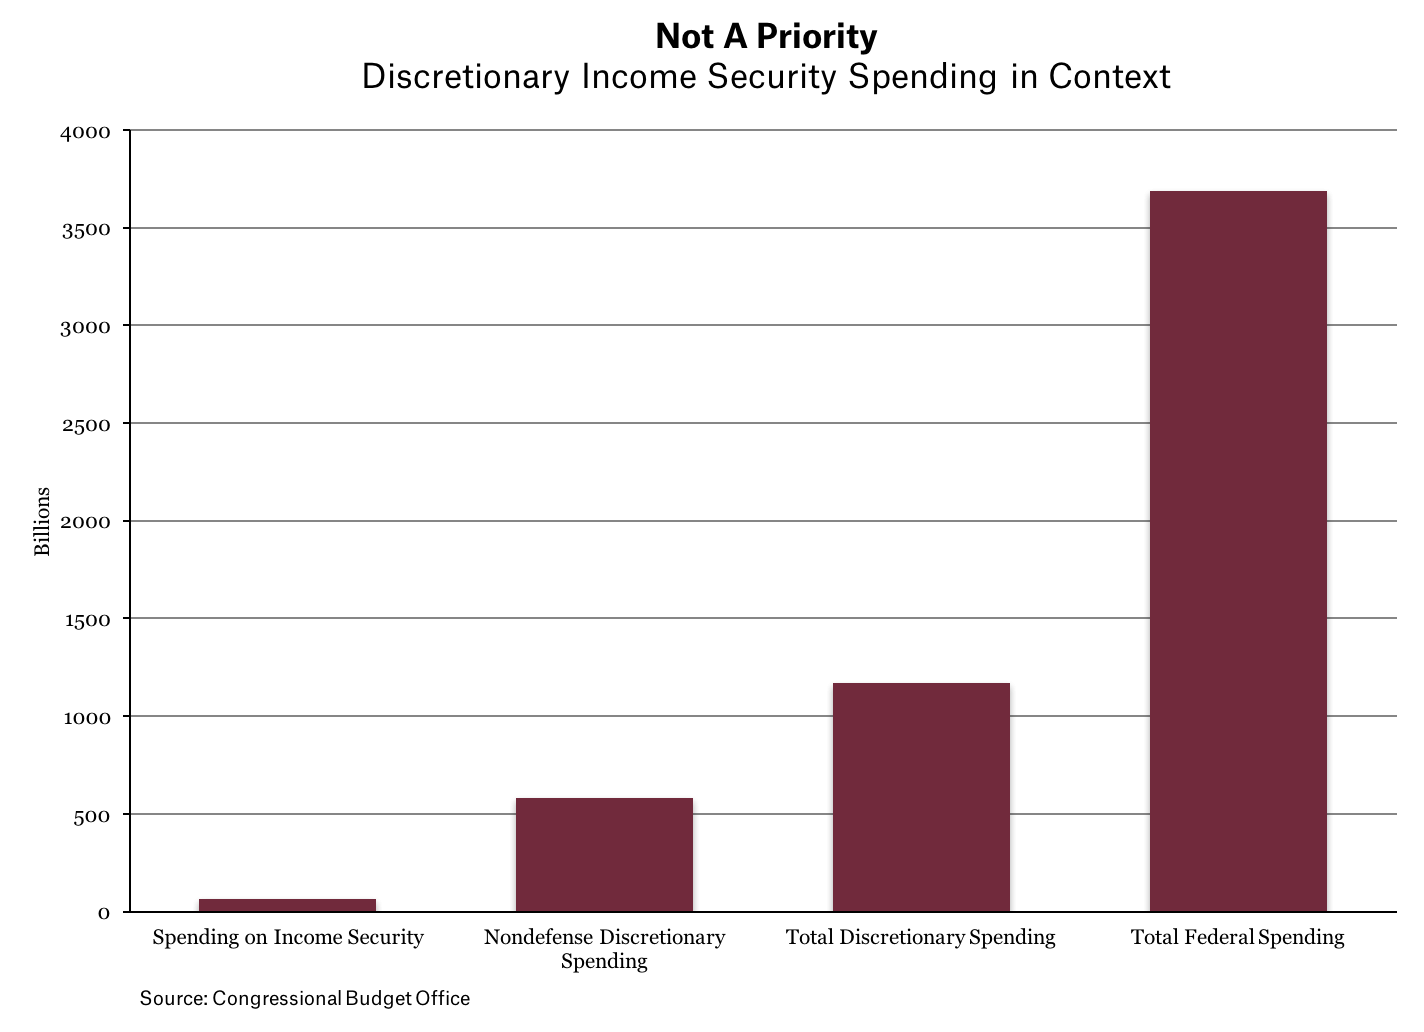
Although critics argue that programs for low-income people take a disproportionate share of the federal budget, in fact they are modest. Economic security programs represent only 14 percent of all federal domestic discretionary spending, which is turn is only 16 percent of the total federal budget. This means that discretionary economic security programs are only 2.2 percent of overall federal spending.
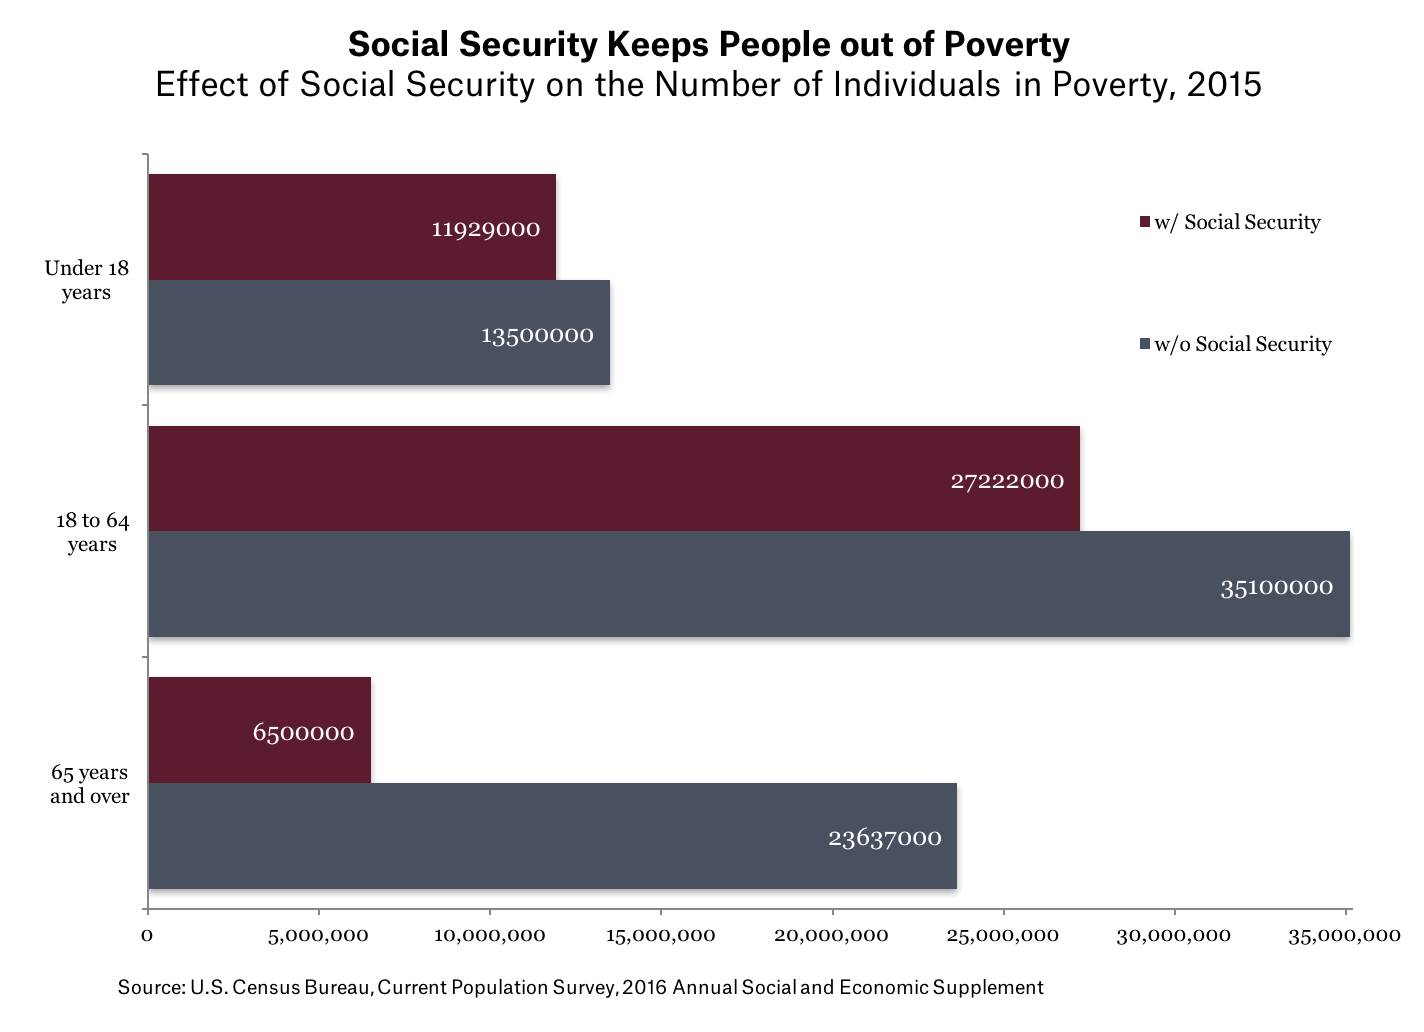
The relative stability of the poverty rate has led some critics to assume that government spending has no impact on poverty. But this is wrong. Without these vital programs, many more people would fall into poverty. Social Security, both the old age and disability programs, has the biggest impact. Without Social Security, the overall supplemental poverty rate would have been 8.3 percentage points higher and the poverty rate for older Americans would have been 49.7 percent. Social Security has kept 26.2 million individuals out of poverty.
Social Security is not the only program with a substantial anti-poverty impact. The Supplemental Nutrition Assistance Program (SNAP, formerly known as Food Stamps) relieved 4.6 million people from living below the poverty line in 2015. A large majority of people using nutrition assistance is either employed, too young to work, over 65 years old, or disabled.

Government programs have had a substantial impact on fighting poverty. According to one estimate, when the effects of government programs are put into poverty measurement, programs now are cutting poverty “nearly in half” compared to only a one percent reduction in 1967, with the impacts especially strong for child poverty. Over two-thirds of Americans who were between the ages 14 and 22 in 1979 got some type of government income support between 1978 and 2010.
Weak Incomes and Inequality are a Major Contributor to Poverty
Focusing on government programs should not distract us from the bulwark maintaining poverty—good, well-paying jobs. Anti-poverty programs can only do so much in the face of stagnant incomes and historic levels of inequality. Changing the rewards to work is essential for reducing poverty.
Household income adjusted for inflation has grown relatively slowly for most Americans. Between 1967 and 2016, American real Gross Domestic Product grew by 282 percent, while median income only grew by 21.2 percent, and income for the bottom ten percent grew by 21.8 percent, an average of less than one-half of one percent per year. Such slow income growth will not reduce poverty, or help middle-class households get ahead.
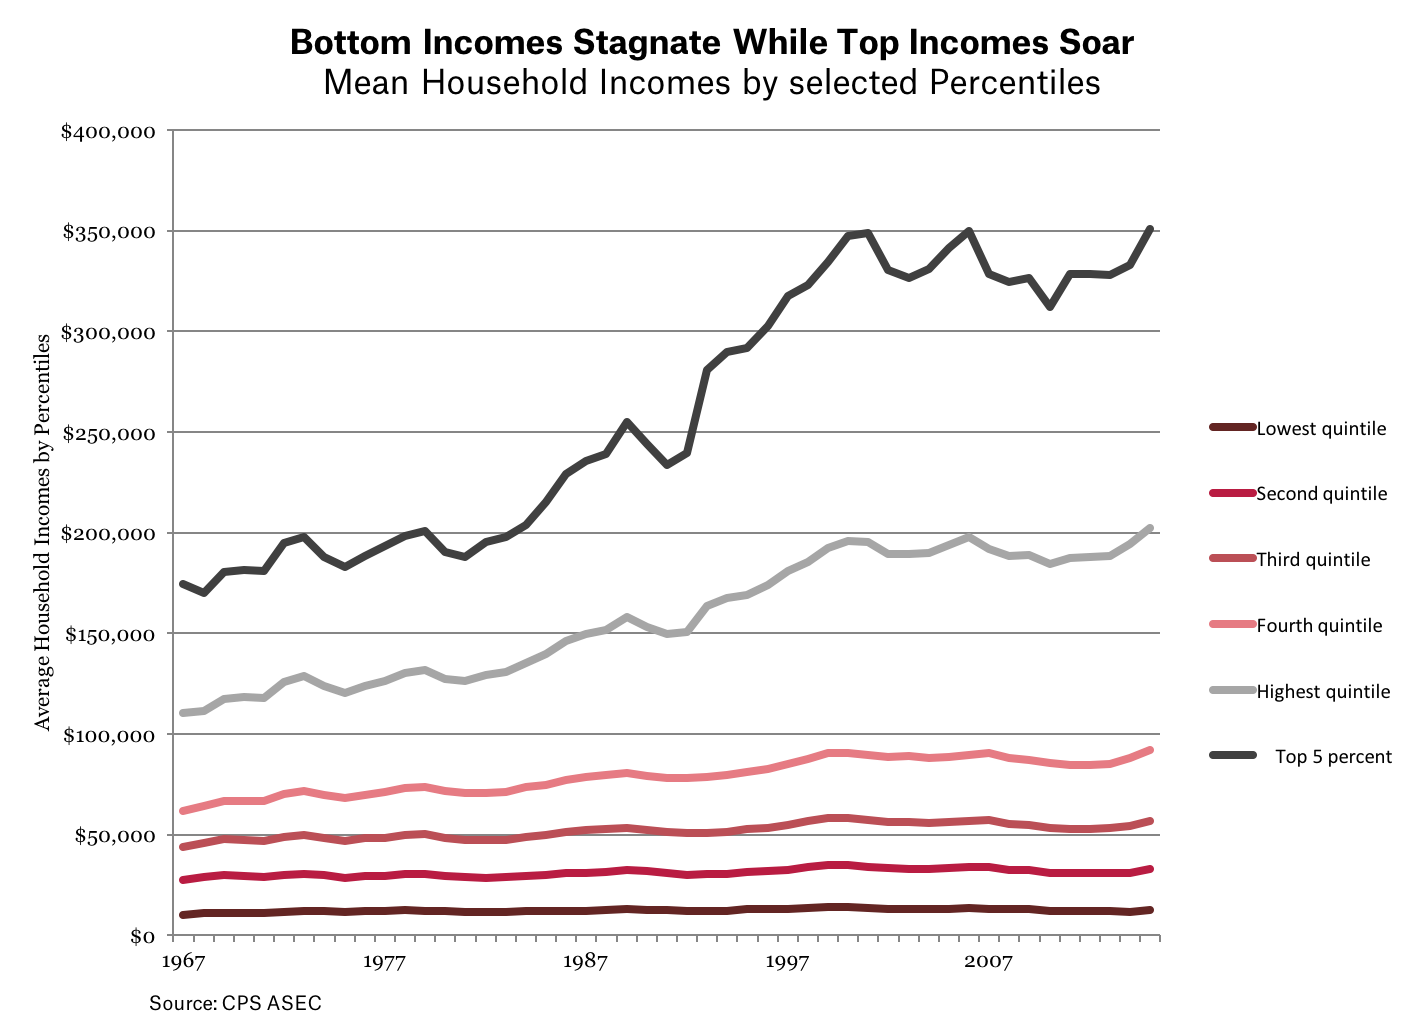
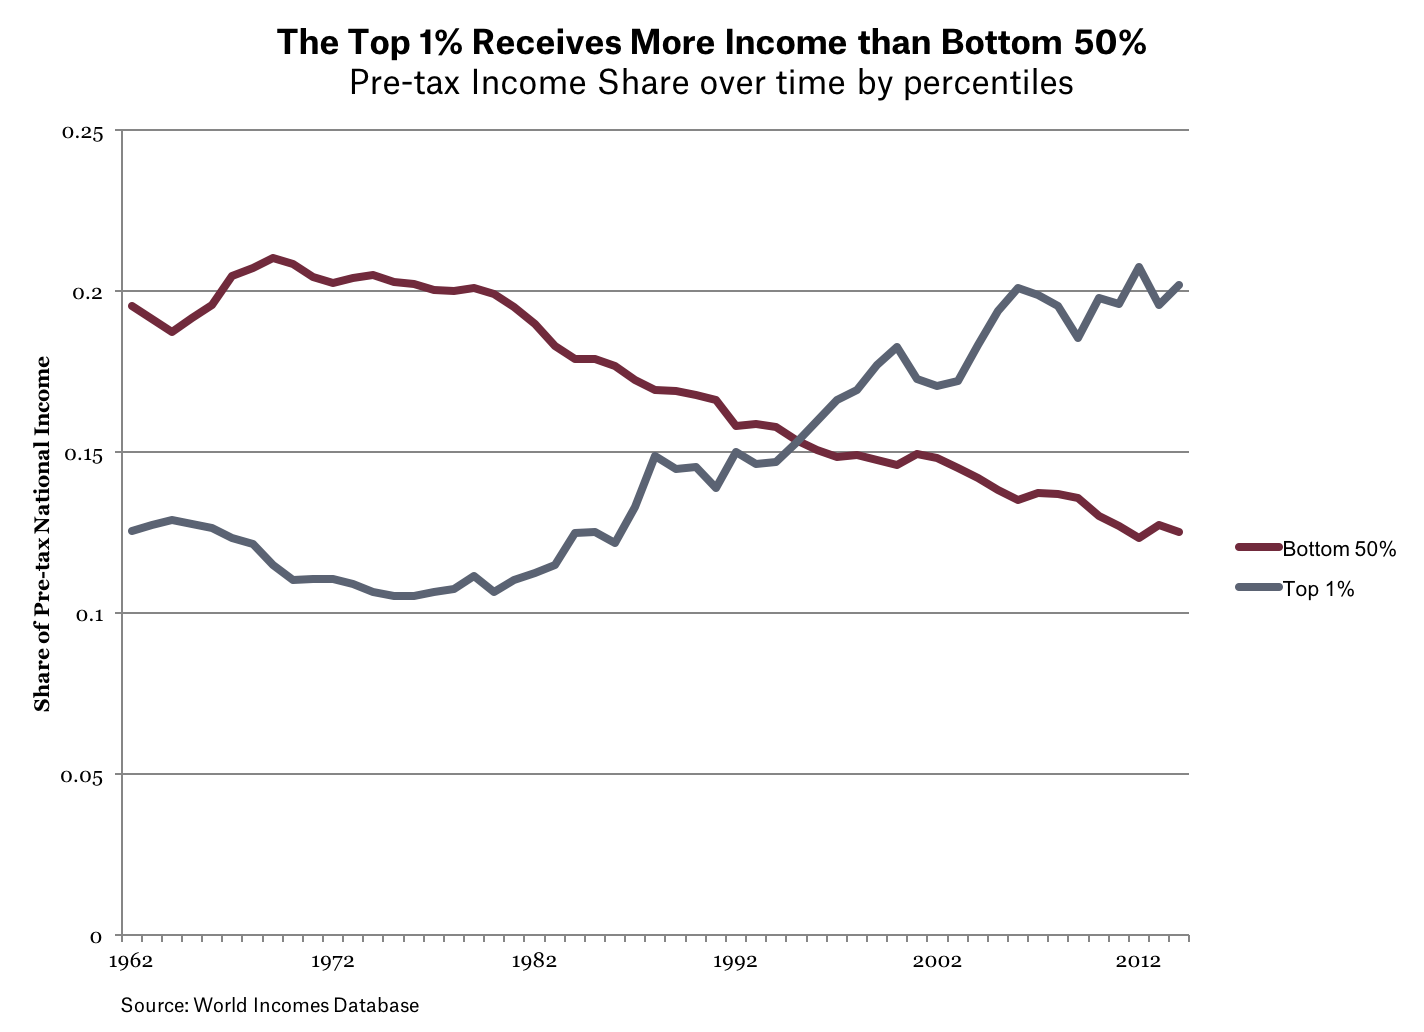
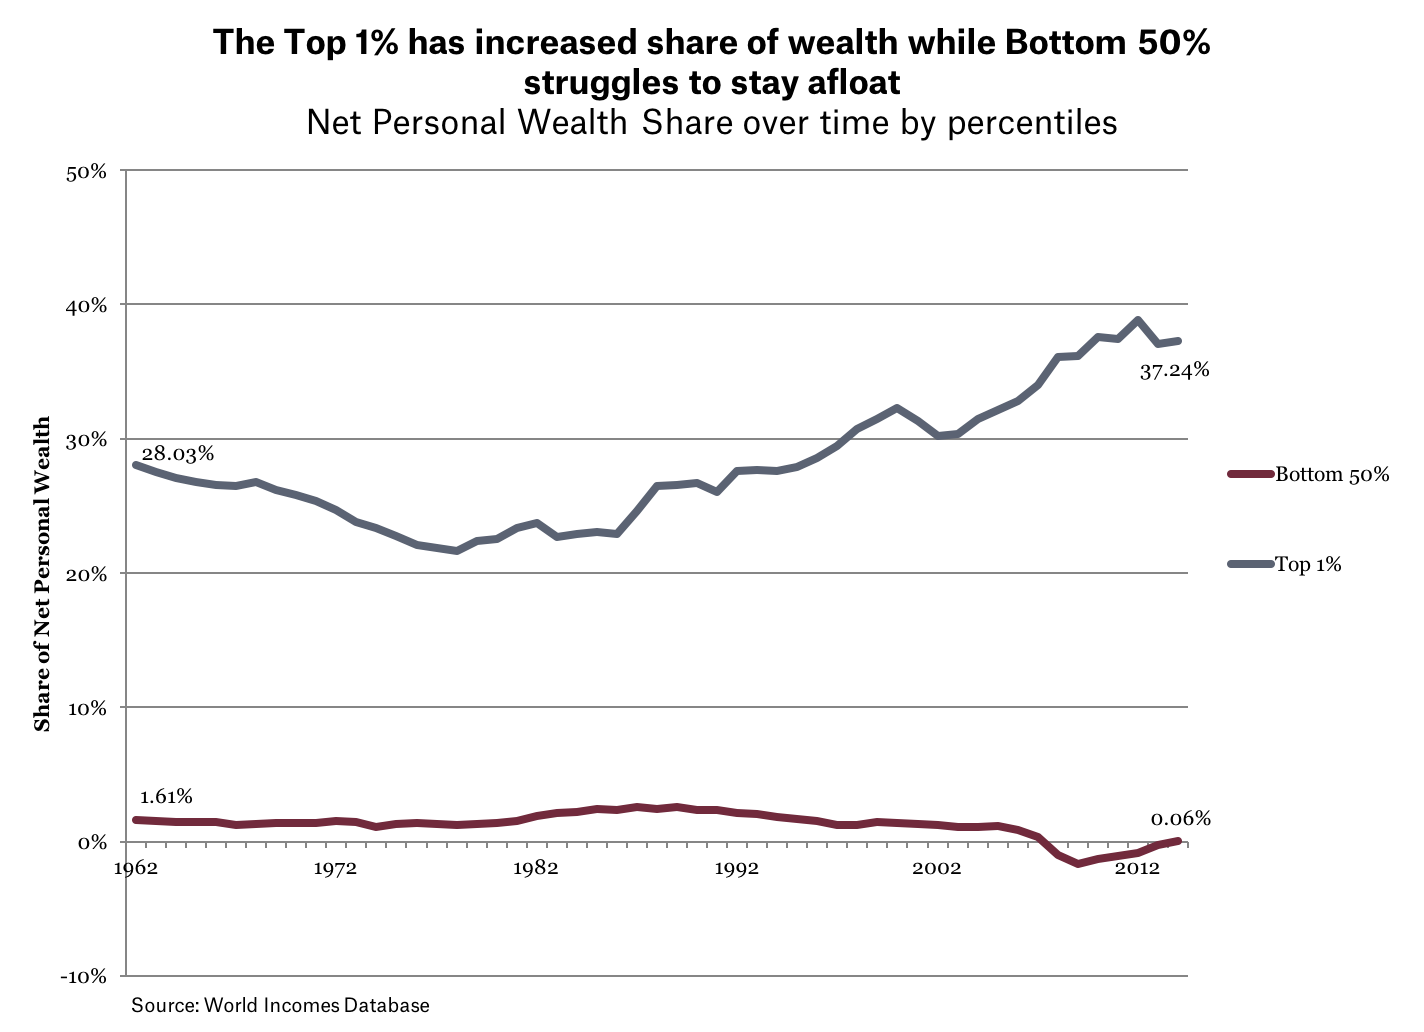
Inequality has steadily increased over the past 50 years. This is reflected in stagnating incomes for the bottom 60 percent of earners while the top 5 percent has enjoyed substantial incomes. As of 1995, the top one percent share of income has exceeded to share of income for half of all Americans. Inequality in wealth has also been steadily increasing, particularly for the past 30 years.
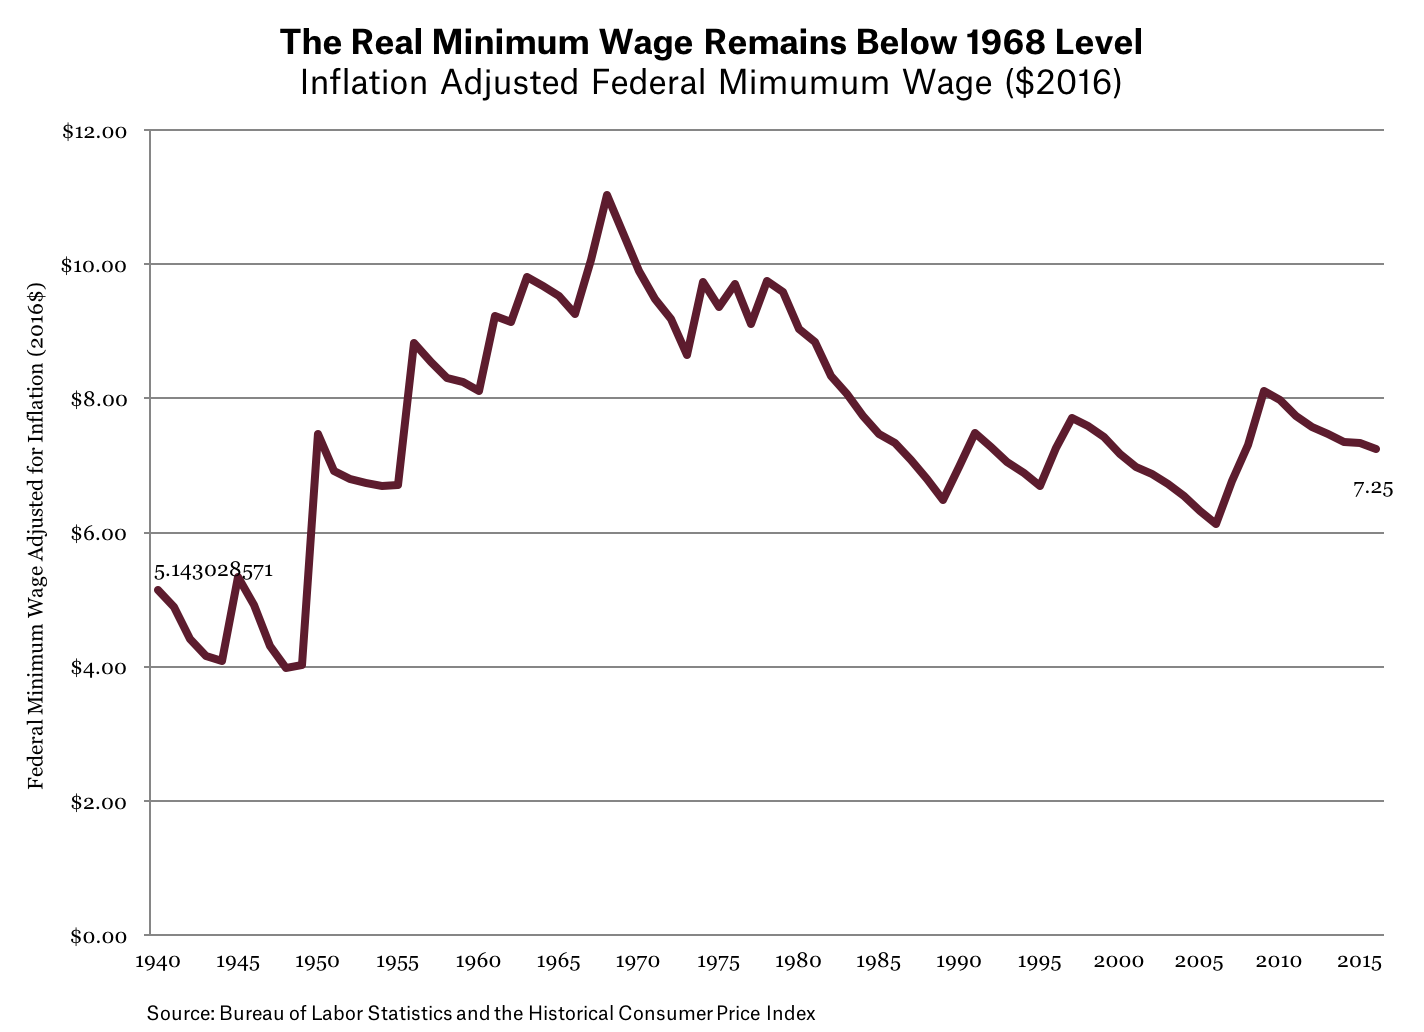
Although many factors have contributed to slow income growth, stagnant wages are a main cause. And for poor people, wages have been low for a long time. The federal minimum wage has lagged well behind inflation, with its real value peaking at $8.68 per hour in 1968. Currently, the federal minimum wage of $7.25 per hour is sixteen percent the real value of 49 years ago.
A single person who worked full-time at the federal minimum wage would have an income below the poverty level, and if they had children, their poverty would be even more severe. (The real value of the MW peaked in 1968.) Many anti-poverty programs—nutrition assistance, housing, tax credits like the Earned Income Tax Credit (EITC), and Medicaid—help support poor working families.
The reverse of stagnant wages and household incomes has been a dramatic rise in inequality, especially for the top one percent of household incomes. Inequality in the United States has reached historically high levels not seen since the “Roaring Twenties,” just before the Great Depression.

Source: Saez 2016
Is Poverty Mismeasured?
One critique of poverty data argues that poverty is not as bad as it seems, given basic household living standards. This analysis argues that those measured as in poverty “are not actually poor in any ordinary sense of the term,” because most poor households are not “near destitution,” and the “average poor household has many modern conveniences” (such as air conditioning, mobile phones, a microwave oven, a color television, or a car).
But other analysts also have considered whether the official measure overstates poverty, because it is based only on cash income for households, not the net value of anti-poverty program benefits. To analyze this, economists have created a “Supplemental Poverty Measure” (SPM) that adds the value of non-cash benefits such as food stamps, housing subsidies, and school lunches, and subtracts necessary costs such as taxes, expenses related to work, child care, and out-of-pocket medical expenses.
Although the SPM and the official poverty rate differ for some groups of the population, by and large the two rates tell the same story. In 2015, the official rate for all people was 13.7 percent compared to 14.3 percent using the SPM. Poverty for children under 18 years old was seen to be lower, largely due to the value of school programs and the lack of costs for work.
But using the SPM for adults found higher poverty rates, especially for the elderly. For those 18 to 64 years old, the SPM was 1.4 percent higher than the standard measure, and for those over 65, it was 4.9 percent higher, an over 50 percent increase. So using an alternative poverty measure does not result in less measured poverty, and for many people, it shows higher poverty.
Other analysts have used data from administrative records and combined it with official income survey data. One of these studies found that using administrative records shows higher benefit use than reported in surveys, meaning that overall poverty rates would be “markedly lower.” But that is because “the effects of government programs in reducing poverty are sharply understated.” Contrary to those who say anti-poverty programs don’t work, this line of research supports other findings that show measured poverty would be much higher without government anti-poverty programs.
So, alternative poverty measures often result in higher poverty levels, not lower ones. And while using administrative records shows overall higher levels of household well-being, that finding indicates that anti-poverty programs work.
Conclusion
Poverty remains a vexing problem in the United States. It is unequally distributed, with people of color and women suffering higher poverty rates. But it also cuts across all Americans—black, white, and Latino; urban and rural; men and women; children, working-age adults, and the elderly.
Poverty is driven primarily by inadequate incomes and economic opportunities. Wages and incomes have stagnated for the majority of Americans, dragging some down into poverty. Extreme inequality of income and wealth contributes to poverty, both immediately and by affecting the life chances of children—the children of the wealthy have a much better chance of success than a child raised in poverty.
Anti-poverty programs have kept millions of Americans out of poverty. Contrary to what some critics claim, government spending has been very effective at reducing poverty for a variety of groups. But government programs cannot by themselves substitute for a more robust economy with fair and equal opportunities for all.
Poverty is multidimensional. Although this report has focused on economic poverty, it radiates into housing, health, education, criminal justice, and upward mobility, which in turn affect economic poverty. During the coming year, we will analyze these interactions in more detail, to document how much poverty hurts all Americans, and why the nation needs a broad, robust campaign to attack poverty.
In his 1963 Letter from a Birmingham Jail, Dr. Martin Luther King, Jr. said “we are caught in an inescapable network of mutuality, tied in a single garment of destiny. Whatever affects one directly, affects all indirectly.” Nowhere is this more true than with poverty in America.
Sources and Notes
(In Order of Introduction)
- U.S. Bureau of the Census, Current Population Survey, Annual Social and Economic Supplements (CPS ASEC). 2016. For information on confidentiality protection, sampling error, nonsampling error, and definitions, see www2.census.gov/programs-surveys/cps/techdocs/cpsmar16.pdf
- Brundage, Amy, and Jessica Schumer. The War on Poverty: 50 Years Later (2014): Obamawhitehouse.archives.gov. Web.
- Greenstein, Robert, Richard Kogan, and Isaac Shapiro. 2017. “Low-Income Programs Not Driving Nation’s Long-Term Fiscal Problem: Programs Outside Health Projected to Decline Relative to Economy.” Center on Budget and Policy Priorities (CBPP). (21 February, Web)
- Wimer, Christopher, Liana Fox, Irv Garfinkel, Neeraj Kaushal, and Jane Waldfogel. “Supplemental Poverty Measure.” The SAGE Encyclopedia of World Poverty (2013): Web
- Congressional Budget Office (CBO). 2017. “Historical Budget Data.” (January, Web)
- Congressional Budget Office (CBO). 2016. “A Closer Look at Discretionary Spending.” (January, Web)
- Renwick, Trudi, and Liana Fox. 2016. “The Supplemental Poverty Measure: 2015.” U.S. Department of Commerce, Economics and Statistics Administration. (13 September, Web)
- Bureau of Economic Analysis (BEA). 2017. “Gross Domestic Product.” (30 March, Web)
- U.S. Bureau of the Census, Current Population Survey, Annual Social and Economic Supplements (CPS ASEC). 2016. “Table A-2 Selected Measures of Household Income Dispersion: 1967-2015” (https://www.census.gov/data/tables/time-series/demo/income-poverty/historical-income-inequality.html)
- World Wealth and Income Database. 2017. (Web)
- Saez, Emmanuel. 2016. “Striking it Richer: The Evolution of Top Incomes in the United States,” UC Berkeley. (June 30, Web)