
Summers and Stansbury Get It Half Right
Like everyone else taking Economics 101, central bankers are taught that the value of output equals its cost of production, or that the price level per unit output equals the cost. Ignoring intermediate transactions and taxes, cost is the sum of payments to labor and profits. When it comes to setting monetary policy, however, the bankers forget the price = cost relationship and only talk about price – how low interest rates, forward guidance, quantitative easing, etc. will make it grow faster. But prices won’t rise consistently unless nominal unit labor cost – the money wage divided by labor productivity – goes up as well. American wage growth has been repressed for 50 years. That is why there is low inflation. It will stay stuck in place until long-standing institutional restrictions on labor’s bargaining power are lifted.
In a recent contribution, Lawrence H. Summers and Anna Stansbury (2019, hereafter S&S) fall part way into the bankers’ trap. They argue for expansionary fiscal policy to spur output growth and thereby price inflation, and also rightly criticize current economic orthodoxy for its obsession with nominal and real rigidities supposedly limiting economic performance. They also suggest that cutting interest rates is not likely to boost aggregate demand. All these ideas are worth discussing.
Wage Repression
Regarding inflation, both central banks and S&S ignore the facts that inflation is a cumulative process driven by conflicting claims to income and wealth and that for the past five decades profits have captured almost all the claims.
Consider the real “product wage,” the nominal or money wage divided by a producer price index (PPI) to correct for cost inflation confronting business. A little algebra (see the appendix) shows that the labor or wage share of output, which equals real “unit labor cost,” is equal to the real wage divided by productivity or the output/labor ratio. The profit share equals one minus the wage share.
Following Taylor (2020) Figure 1 shows how the profit share and growth rates of real wages and productivity have varied over time (recessions are shaded). Real wage growth lagged productivity growth for almost 50 years after 1970, causing the profit share to grow at 0.43% per year, 1970-2018. Annual growth at a rate of 0.4% (= 0.004) looks tiny but over 50 years it cumulates to 27%. That’s a big change for any income share! The real profit level grew at 3.2% per year vs 2.8% for real GDP.
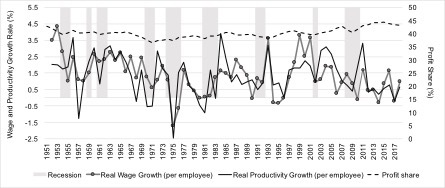
Figure 1: Real wage and productivity growth rates and profit share
Profit growth was especially strong after the 2001 recession, while real wage growth tailed off notably after a post-recession spurt. The spurt was a phase in a cyclical pattern (which can be traced to Karl Marx in the 19th century and the Cambridge economist Richard Goodwin in the 20th) superimposed on the rising profit share. Except around 1995 and 2015 productivity growth led real wage growth as economy emerged from recessions. Typically since 1970, productivity growth has been stronger. Subsequent wage growth and a dip in the profit share lead into a new recession. The profit dip predicts recession as well as a falling or negative long-term interest yield premium —- both suggest that the next recession is nigh.
Figure 2 presents the history of nominal wages. Their peak growth fell by seven percentage points since the 1980s (upper diagram), pulling down price inflation. Wage repression is often built into contractionary macroeconomic shocks like the one administered by the Federal Reserve in 1980, but is especially insidious in the USA because it is so long-standing.
Increases in the nominal wage were especially weak after around 2000, in line with the slower real wage growth noted above. Wage stagnation after the 2007-8 recession is particularly striking because the unemployment rate fell from over 10% to 3.8%. The idea that there is a “non-accelerating inflation rate of unemployment” or NAIRU fell by the wayside.
The growth rate of nominal unit labor cost is the difference between rates of wage and productivity growth. The lower chart in Figure 2 shows growth rates of labor cost and a PPI. Both went down with the Fed’s 1980 shock but thereafter PPI growth exceeded cost growth, especially during the 2000s (the dips in the PPI in 2010 and 2015 were due to collapsing energy prices). As with the other labor market indicators, cost growth slowed after 2000.
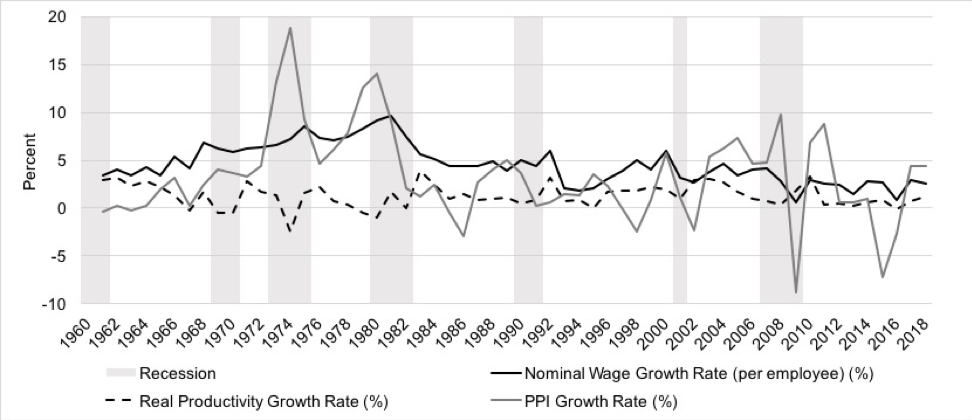
Figure 2: Wage and price inflation rates
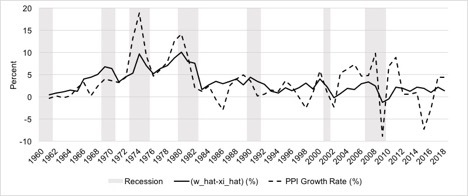
Figure 2: Wage and price inflation rates
Conflicting claims inflation
To unravel the dynamics, we need a theory of inflation. Around the turn of the 20th century the Swedish economist Knut Wicksell pointed out that inflation is a “cumulative process” involving feedback between price and wage inflation rates. Even after their long decline, Figure 1 shows that labor payments still make up 55% of production costs and have to enter inflation accounting. The simplest Economics 101 story, however, ignores Wicksell. Figure 3 is an illustration of how the price level (not the growth rate of prices, or inflation) might be determined.
The diagram’s key assumption is that the nominal cost of production (a mark-up on the money wage) is constant when output is below the “full capacity” level X_1. A relatively low level of demand will peg output at X_0 and the price level at P_0. Higher demand will collide with the capacity limit, and force the price to rise to P_1, pushing up the mark-up and reducing the labor share.
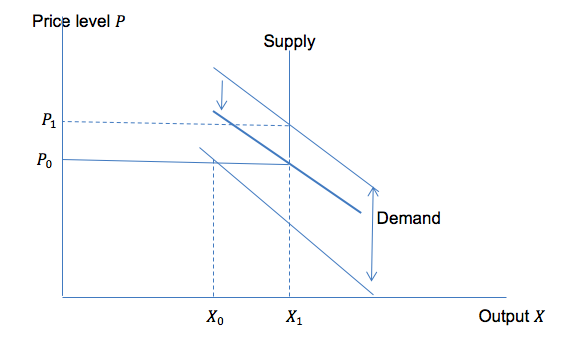
Figure 3: Price level determination
This model violates macroeconomic accounting restrictions. If output cannot exceed capacity, then some mechanism must force the demand schedule to slide downward to the kink in the supply curve, as shown by the heavy line in the diagram. Two show up in the literature.
The “real balance effect” (or the “inflation tax” in a dynamic version) says that a jump in the price level will reduce the real value of assets with prices fixed in nominal terms – money is the usual example. Wealth is eroded and households are supposed to save more as a consequence. Along with a wage lag, the real balance effect is the key adjustment mechanism in Milton Friedman’s (1968) “inflation” model which still underlies contemporary monetary policy. (The quotation marks are meant to signal that the model really does not discuss inflation – see below.)
“Forced saving” happens when a price jump against a constant money wage reduces real payments to wage-earners. If their capacity to borrow is limited, they have to cut consumption, sliding the demand curve downward. Given the wage lag shown in Figure 2, this linkage probably matters more than real balances. If an expansionary package does drive up the price level, middle class and low income households who rely on wages would be the ones to suffer.
Inflation dynamics
Fortunately, the model of Figure 3 can be extended to a more plausible “conflicting claims” inflation theory. Conflict arises because price increases are controlled by business while the money wage is subject to bargaining between business and labor. Both sides seek to manipulate the labor share as a key distributional indicator.
In an overall inflationary environment, business can respond immediately to increases in the wage share or output by pushing up the rate of price increase in Phillips curve fashion along the “Inflation” schedule in Figure 4. Money wages on the other hand are not immediately indexed to price inflation so that they will follow with a lag. Labor will push for faster wage inflation when the wage share is low. The “stable share” schedule with a negative slope will emerge from this process (the algebra is sketched in the appendix). It will be steeper, the stronger is labor’s bargaining power. The small arrows show that if the labor share is low (or high) then it will tend to rise (or fall) until it hits the stability curve.
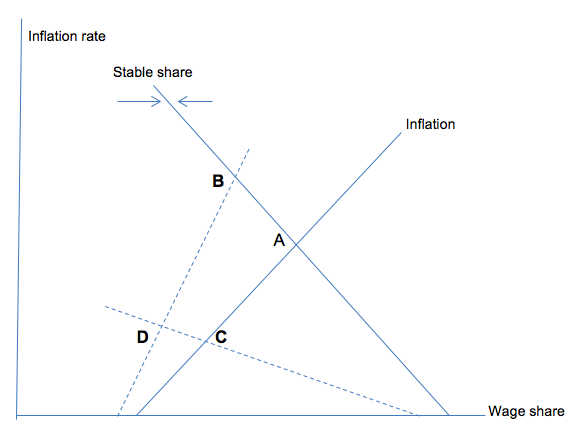
Figure 4: Inflation dynamics
Suppose that there is an initial inflation equilibrium at point A. The S&S proposal to use fiscal policy to stimulate aggregate demand would shift the inflation locus upward (dashed line) with more rapid inflation and a somewhat lower wage share in macro equilibrium at B along the stable share schedule. In light of the vanishing NAIRU over the past two decades, it is not clear how strong this upward shift could be.
Alternatively, under wage repression, the ability of workers to attain a high wage share could be weak, as illustrated by the dashed stability locus with a shallow slope. In response to expansionary policy beginning at C, there would be a modest increase in inflation and a substantially lower wage share ending up at D. Wage repression would stave off inflation under any fiscal or monetary expansion.
The way that expansionary policy could pay off in terms of inequality and (possibly) faster inflation would be though an upward movement in the stable share schedule if the labor market tightens, leading to greater bargaining power for labor. Even though measured unemployment plummeted over the past decade, underemployment remains. There has been a big employment shift (14% of the labor force between 1990 and the mid-2000) toward producing sectors with low wages and productivity and slow productivity growth (Taylor, 2020). Aggressive demand stimulus could reverse this trend. Shifting jobs from the education and health, business services, and accommodation and food sectors toward manufacturing could pull up wages at the bottom and promote income growth at the top.
Finally, it is also true that contemporary low interest rates are a consequence of low inflation. As observed by S&S, rising asset prices and the speculative frenzy that led into the recent (and future?) financial crisis are consequences. Greater labor militancy could drive up the inflation and real interest rates and cause fiscal debt growth to increase, with potentially difficult consequences.
Institutions
The institutional structure underlies wage repression. Here is a quick sketch based on Taylor (2020).
There are important political economy factors affecting wage income for most workers. One is change in institutional norms: laws, unionization and other informal rules of the game. Robert Solow (2015), the doyen of mainstream macroeconomics, observes that labor suffered for several reasons. “The decay of unions and collective bargaining, the explicit hardening of business attitudes, the popularity of right-to-work laws, and the fact that the wage lag seems to have begun at about the same time as the Reagan presidency,” Solow says, “all point in the same direction: the share of wages in national value added may have fallen because the social bargaining power of labor has diminished.”
Falling or stable wages are exacerbated by non-poaching and non-competition clauses in labor contracts, which restrict job opportunities outside a company for a worker who leaves it. These exemplify divide-and-rule employment tactics in a “fissuring” market. The “gig” economy is another manifestation. Gig workers make up 8-10% of the labor force, trending slightly downward (according to Census data) or upward (based on income tax self-employment earnings).
A complementary, more orthodox microeconomic interpretation is that business monopsony (or single buyer) power has grown stronger in the labor market. Microeconomics traditionally focuses on “agents” which take prices as given or subject to a degree of local control. But agents on one side of a market may confront those on the other who lack socially embedded bargaining power as in Solow’s description. Expansion of free markets cuts directly into labor’s bargaining position. The Great Recession and a general acceptance of austerity to hold down barely visible inflation as a desirable policy goal have surely been recent contributing factors as well. See the comments above on employment shifts since 1990.
Rigidities
With regard to rigidities and frictions, S&S are rowing upstream against a strong current. A little history of economic thought helps explain.
In his General Theory, John Maynard Keynes (1936) rejected the idea that the economic system tends naturally toward full employment of all production inputs including labor. Rather, overall demand determines output and employment. If demand weakens, output will fall. This principle of effective demand is the heart of the General Theory.
Since the late 19th century, economists have been indoctrinated by Dr. Pangloss with the notion that unless a barrier stands in the way the economic system tends toward some sort of “optimal” configuration which embodies full employment. In the depths of the Great Depression such thinking suggested that money wages were the barrier. They could be reduced to cut costs and stimulate demand for labor. How widely this idea was accepted is unclear but Keynes attacked it directly. On practical grounds an economy-wide wage cut would be impossible to organize. More fundamentally, if price equals cost, then lower wages would just pull down the price level in proportion, so that firms would have no incentive to employ more workers. To stimulate demand and production, you would have to rely on other interventions, e.g. fiscal policy.
At the time the Cambridge Professor A.C. Pigou was Keynes’s great antagonist. He accepted the price-cost linkage, but pointed out that if wage-cutting reduces the price level the real balance effect can kick in. A lower price level will increase money-holders’ wealth, they will save less, and aggregate demand will rebound.
In retrospect on practical grounds Pigou’s argument is absurd, but it mesmerized macroeconomists for decades. If as was accepted after WWII the price level is proportional to the money supply, then as the future Nobel Laureate and inventor of the NAIRU Franco Modigliani (1944) said, unemployment happens because wages are too high “relative to the quantity of money.” A nominal rigidity in the system supersedes effective demand, annihilating jobs.
Dropping the cost function, Friedman’s model mentioned above said much the same thing. Its output level starts from a “natural rate of unemployment” (which later morphed into the NAIRU). An increased supply of “helicopter money” will bid up price against the money wage, increasing profits and stimulating firms to expand production and hire more labor. Eventually the wage will catch up with the higher price so the system will return to the pre-existing real wage and natural rate but at higher price and wage levels. An on-going inflation will emerge only if the helicopters drop an exponentially growing supply of money. NAIRU models look more like Figure 4 because they write a Phillips curve in terms of price level growth instead of level but the story is much the same.
Along with many others, Paul Samuelson (1964), the leading economic theorist of the time, emphasized the fixed nominal wage: “Had Keynes begun his first few chapters with the simple statement that he found it realistic to assume that modern capitalist societies had money wage rates that were sticky and resistant to downward movements, most of his insights would have remained just as valid.”
Samuelson launched a “neoclassical synthesis” resting on the fixed wage notion. The real balance effect gradually faded from view but rigidity grew in influence. The new Keynesian school emerged from the synthesis, propelled by the invention of a slew of frictions and rigidities – staggered contract negotiations perturbing labor markets, “menu costs” of changing prices and wages, prices locked into inefficient levels by contracts, probabilistic price revision, monopsony power of firms in labor markets, on and on. In the process, any and all discussion of effective demand was submerged.
The new Keynesian inventors are now the ruling elders of macroeconomics, unlikely to change their minds. So much for Keynes for now, but S&S might remember with Max Planck that science advances one funeral at a time. They are certainly correct in saying that “the role of particular frictions and rigidities in underpinning economic fluctuations should be de-emphasized relative to a more fundamental lack of aggregate demand.” Convincing their peers is far more easily said than done.
Interest rates
Just two points about interest rates are worth making.
First, many of the correct observations that S&S make about the likely ineffectiveness of interest rate changes were raised almost 90 years ago by Keynes’s colleague Piero Sraffa (1932a, 1932b) in a controversy with Friedrich von Hayek. Sraffa’s main emphasis was on the inapplicability of a “natural rate” of interest, a point amplified by Keynes in the General Theory.
The natural rate, nevertheless, remains a topic of great interest to left-leaning new Keynesians. How they reconcile that idea with the fiscalist Keynesian perspective adoped by S&S remains to be seen.
Bottom line
S&S, to their credit, point to fundamental contradictions that central bankers confront. They cannot control inflation in a world of conflicting claims. The bankers’ chosen instrument, the interest rate, has little macroeconomic traction. How institutions largely determine output, employment, and inflation is beyond their ken. Demand drives output and prices, but it is not clear that the fiscal expansion S&S propose will boost inflation under existing labor market institutions. It is possible that both wage equality and inflation could rise if economic expansion combined with supportive regulation boosts workers’ bargaining power in the labor market.
Appendix
Here is a quick sketch in algebra of the model underlying Figure 4. Let X be real output with a price level P. The capital stock is K, which basically scales the system. Capital utilization is u=X⁄K and labor productivity is ξ=X⁄L with L as employment. The nominal wage is w and the real wage ω=w⁄P. The labor share or real unit labor cost is ψ=ω⁄ξ. Nominal unit labor cost is Pψ=w⁄ξ. We ignore productivity growth for simplicity.
The rate of price inflation is P ̂=P ̇⁄P with P ̇=dP⁄dt. The “Inflation” Phillips curve in Figure 4 is
P ̂=f(u,ψ)
with positive partial derivatives.
Money wage growth is incompletely indexed to inflation and is faster with a low labor share,
w ̂= λP ̂+γ(θ-ψ)
in which there is a wage lag with λ<1 and γ is an indicator of labor’s bargaining power.
At an inflation equilibrium w ̂=P ̂ implying that
P ̂=(γ(θ-ψ))⁄((1-λ))
which is the “stable share” schedule in Figure 4. If w ̂ also increases with u, expansionary policy could have a bigger effect on P ̂.
References
Friedman, Milton (1968) “The Role of Monetary Policy,” American Economic Review, 58: 1-17.
Keynes, John Maynard (1936) The General Theory of Employment, Interest, and Money, London: Macmillan.
Modigliani, Franco (1944) “Liquidity Preference and the Theory of Interest and Money,” Econometrica, 12: 45-88.
Samuelson, Paul A. (1964) “A Brief Survey of Post-Keynesian Developments,” in Robert Lekachman (ed.) Keynes’s General Theory: A Report of Three Decades, New York: St. Martin’s.
Solow, Robert M. (2015) “The Future of Work: Why Wages Aren’t Keeping Up,” Pacific Standard, August 15, https://psmag.com/the-future-of-work-why-wages-aren-t-keeping-up-6fcfac468e4#.j0iys3wc8
Sraffa, Piero (1932a) “Dr. Hayek on Money and Capital,” Economic Journal, 42: 42-53.
Sraffa, Piero (1932b) “Money and Capital: A Rejoinder,” Economic Journal, 42: 249-25.
Summers, Lawrence H., and Anna Stansbury (2019) “Whither Central Banking?” https://www.project-syndicate.org/commentary/central-bankers-in-jackson-hole-should-admit-impotence-by-lawrence-h-summers-and-anna-stansbury-2-2019-08
Taylor, Lance (2020) Macroeconomic Inequality from Reagan to Trump: Market Power, Wage Repression, Asset Price Inflation, and Industrial Decline , New York: Cambridge University Press.