
The Pay Ratio Disclosure Rule
In August 2015 the Securities and Exchange Commission (SEC) determined that, beginning in January 2017 under the Pay Ratio Disclosure Rule (PRDR), each U.S. public corporation must publish annually the ratio of the pay of its CEO to that of its median worker.[1] The new SEC disclosure requirement implements a section of the Dodd-Frank Act of 2010 that seeks to expose extreme pay gaps within corporations, track them over time, and permit cross-company comparisons of CEO-worker inequality.[2]
On February 6, 2017, SEC Acting Chairman Michael S. Piwowar issued a public statement titled “Reconsideration of Pay Ratio Rule Implementation,” in which he called for public comment on the PRDR because it was his understanding “that some issuers have begun to encounter unanticipated compliance difficulties that may hinder them in meeting the reporting deadline.” Chair Piwowar instructed the SEC staff “to reconsider the implementation of the rule based on any comments submitted and to determine as promptly as possible whether additional guidance or relief may be appropriate.”[3] As scholars at a nonprofit academic research organization The Academic-Industry Research Network, we offer the following response to Chair Piwowar’s request for public comment.
Why we want a CEO-to-worker pay ratio
A civilized society seeks to attain the socioeconomic goals of stable and equitable economic growth, or what can be called “sustainable prosperity.”[4] Through economic growth based on rising levels of productivity, a society generates the possibility of higher living standards for its people. But we also want economic growth to be stable over time, avoiding severe downturns that cause hard-working people to lose their jobs and bubble-like booms that cause overly-optimistic people to take on unsustainable debt. And we want economic growth to be equitable so that those workers, taxpayers, and financiers who contribute to the process of growth receive their fair shares of the returns.
Much if not most of the processes of generating economic growth, managing its stability, and sharing its gains occur within business corporations that develop and utilize the society’s productive resources. In the economy of the United States, productivity, employment, and earnings depend heavily on the resource-allocation decisions made by CEOs and their senior-management teams at a relatively small number of very large companies.[5] In 2012, 1,909 companies that had 5,000 or more employees in the United States, with an average workforce of 20,366, were only 0.033 percent of all U.S. businesses. But, with the business sector representing 81 percent of the total employed civilian labor force, these 1,909 companies had 11 percent of all establishments, 34 percent of employees, 38 percent of payrolls, and 44 percent of revenues.[6] In addition, the prosperity of hundreds of thousands of smaller firms relies on the continued success of these large firms.
In the United States, income inequality is inordinately high, with an increasing concentration of income among the richest 0.1 percent of households.[7] The remuneration of the senior corporate executives of the largest companies makes them well-represented among the top 0.1%.[8] More generally, academic research shows that the source of much of that inequality can be found in the ways in which the nation’s largest business corporations govern the allocation of resources and employ their labor forces. In principle, therefore, it can be useful to the quest for sustainable prosperity to have an indicator of the extent of inequality within companies such as the CEO-to-median-worker (CMW) ratio mandated by the Dodd-Frank Act and implemented by the SEC’s PRDR. A high and rising CMW ratio could focus policy-makers in business and government on ways in which to decrease it, while a falling CMW ratio could be a barometer of progress in the quest for stable and equitable economic growth.
What is true in principle is not necessarily the case in practice if the CMW ratio that is adopted is a faulty measure of income inequality. The SEC’s PRDR as currently constituted has three major problems that, in our view, make it a severely flawed indicator for assessing the extent of firm-level inequality:
- The measure of CEO pay that the PRDR requires is an estimated number that often bears little relation to the actual remuneration that the CEO takes home and reports as taxable income to the Internal Revenue Service.
- The PRDR leaves the determination of who represents its “median worker” up to the discretion of each company, thus negating the use of the CMW ratio as a well-defined standard and creating problems for cross-company comparability.
- The extreme increase in inequality between the pay of senior corporate executives and that of rank-and-file workers that has occurred since the 1970s means that, implemented at this late date, the PRDR risks normalizing a CMW ratio that is far too high by historical and international standards.
We argue that, as a first step in remedying these problems, the SEC should reject the fictitious EFV accounting measures of stock-based remuneration in favor of ARG measures that represent the amounts of money that an employee, including the CEO and other senior executives, takes home from his or her stock-based pay. Knowledge of ARG permits an analysis of why senior-executive pay has exploded over the past four decades, exposing the “financialization” of the corporation as the overriding culprit and the phenomenon of stock buybacks as a potent, but illegitimate, means for increasing executive pay.
More than that, a focus on stock buybacks is integral to an explanation of why the real incomes of rank-and-file workers have stagnated since the late 1970s. Stock buybacks that boost executives’ stock-based compensation often come at the expense of the employment security, career advancement, and earnings increases of the company’s labor force. The propensity of corporate executives to allocate corporate cash to stock buybacks is integral to understanding how concentration of income among the top 0.1% and stagnant earnings of most workers have been two sides of the corporate resource-allocation coin. As a result, the rise in the CMW ratio may be driven by both manipulative boosts to the numerator and financialized suppression of the denominator.
Three fundamental problems with the SEC’s Pay Ratio Disclosure Rule
- The CEO pay numbers that the SEC mandates for use in the CMW ratio are estimated fair value (EFV) measures: They represent a hypothetical “before the fact” calculation of what the CEO might eventually gain upon cashing in the stock options and stock awards that, for the highest paid, make up the overwhelming majority of his or her remuneration. Yet we know the actual realized gains (ARG) from stock-based pay that the company’s CEO takes home, puts in the bank, and on which he or she is obligated to pay income taxes. Each publicly listed company reports both ARG and EFV measures of the stock-based pay of its CEO in the proxy statement that it files with the SEC in advance of its annual meeting of shareholders. And, for reasons explained below, ARG tends to be significantly higher than EFV, especially when the stock market is booming. Whether ARG or EFV measures are used, the stock-based components of executive pay tend to make up the lion’s share of the total remuneration of the highest-paid senior executives. Yet the EFV measures obscure the effect that actual stock-price performance has on the amount of remuneration that an executive actually receives.
- If the measure of CEO pay is highly problematic in the SEC’s PRDR calculation, so too is the median-worker earnings measure. Most companies currently provide little public information about the pay of their workers; even total payroll numbers are usually buried in the “general and administrative” and “research and development” expense items in the 10-K income statement. The PRDR accords substantial flexibility to each company in how it calculates median employee pay, using “any consistently-applied compensation measure from compensation amounts reported in its payroll or tax records.”[10] That means that the pay ratios will not be inherently comparable across companies. And in technology companies that have broad-based stock-option plans even the number that is used for the pay of the median worker is likely to be based on the fictitious EFV measures. Or it may be that, in accordance with the current PRDR guidelines, a company with a rising stock price may choose to report a lower CMW ratio by using EFV measures for the CEO but ARG measures for the stock-based pay of its employees.
- A third big problem—which would exist even if the EFV calculation were an accurate measure of CEO pay, which it is not—is that the SEC’s PRDR would normalize CEO-to-worker pay ratios that are already much too high. Last December the city of Portland, Oregon, passed a law that will impose a surcharge on the local business taxes paid by corporations that operate in the city when (using the CMW ratio published under the PRDR) the CEO’s compensation is 100 times or more the median earnings of the company’s employees.[11] But, by implication, a CMW ratio of 100:1 accepts as reasonable a pay gap that is far too wide. In the early 1990s, when concern about excessive executive pay became a hot political issue in the United States, a ratio of 99:1—which would not incur a surtax under the Portland law—compared unfavorably with the ratios in the vicinity of 20:1 that were said to prevail in Japan, Germany, and France.[12] Indeed, in the 1980s Peter Drucker, the management expert who correctly understood that the purpose of the business corporation is to produce an innovative product rather than profits for shareholders, put forward 20:1 as a sufficiently high ratio for any company in any country, including the United States.[13] The implementation of the PRDR should explicitly acknowledge that this indicator is required because income inequality within business corporations has long since gotten out of control.
Measure fact, not fiction
The EFV measures of CEO stock-based pay that are to be used in complying with the PRDR are flawed to the point of being fictitious because the formulae by which they are estimated fail to capture significant changes that can, and often do, take place in a company’s stock price over time. Yet it is significant changes in the company’s stock price that are the prime determinants of a CEO’s ARG compensation from exercising stock options and the vesting of stock awards. In the case of stock options, the EFV formula is typically a Black-Scholes-Merton option-pricing model that, rooted in the “efficient-markets hypothesis,” assumes that changes in a company’s stock-price exhibit a log-normal distribution and thus predicts that most stock-price changes will be very small.
As such, an EFV measure of the remuneration from a stock option will be exceeded in the future by ARG as a result of significant stock-price increases. And given that stock options often expire ten years from the grant date, the executive who holds the option has a very long “window” during which he or she can wait for the company’s stock price to rise. Moreover, once a stock option vests (usually one to four years after the grant date), the executive will have years during which he or she can choose the precise day to exercise the option with a view to realizing gains from stock-price increases, even if those increases are only temporary. That bump to their ARG is the main reason why senior executives who make stock-buyback decisions are highly appreciative of the manipulative boosts to stock prices that buybacks achieve.
In the case of stock awards, the executive’s ARG is the actual number of shares received when an award vests multiplied by the vesting-date stock price. A Black-Scholes-Merton-type option-pricing model is not used to calculate EFV of stock awards. Rather EFV for stock awards is derived by multiplying the number of shares in the award by the grant-date stock price, recorded as the executive’s EFV award income on the vesting date. Hence EFV for stock awards automatically excludes from the calculation extra stock-based gains that accrue when the actual vesting-date stock price is higher than the grant-date stock price. In addition, many companies reward executives with extra shares in a stock award when they hit prescribed financial metrics related to the company’s stock price, thus increasing potential ARG from stock awards when stock prices are rising.
Therefore, as with the EFV of stock options, the EFV of stock awards systematically excludes the impacts of significant stock-price increases on the CEO’s take-home pay. Yet the whole point of stock-based pay is to incentivize and reward the CEO and other senior executives for making resource-allocation decisions that boost the company’s stock price. And, increasingly, to boost stock prices, senior executives allocate corporate resources to buybacks so that they can realize more gains from their stock-based pay.[14]
Figure 1 shows average total compensation of the 500 highest-paid U.S.-based CEOs for each year from 2006 through 2015, using ARG for stock-based pay. Their average total compensation ranges from a low of $12.4 million in 2009, when the stock markets had crashed, with stock-based pay making up 56 percent of the total, to a high of $24.6 million in 2015, with stock-based pay making up 79 percent of the total. U.S. corporate executives are incentivized to boost their companies’ stock prices and are amply rewarded for doing so. In SEC-approved stock buybacks, they have at their disposal an instrument to enrich themselves.[15]
Especially when the stock market is on the rise, total ARG compensation tends to be much higher than total EFV compensation. As shown in Figure 2, for each of the years 2006 through 2015 the average total compensation of the 500 highest-paid CEOs using ARG numbers was greater than the average total compensation of the 500 highest-paid CEOs using EFV measures, and markedly so in the periods 2006-2007 and 2012-2015, when the stock markets were booming.
Figure 3 graphs the data for the stock-based pay only—both stock options and stock awards—of the 500 highest-paid CEOs by ARG measures and by EFV measures, with all four measures drawn from the compensation data for the 500 highest-paid CEOs in each year ranked by total ARG compensation. The ARG measures of stock-based pay are much higher than the EFV measures, especially, as is also shown in Figure 3, in stock-market booms. Indeed, the EFV measures for both estimated pay from stock options and estimated pay from stock awards show very little sensitivity to stock-price movements.
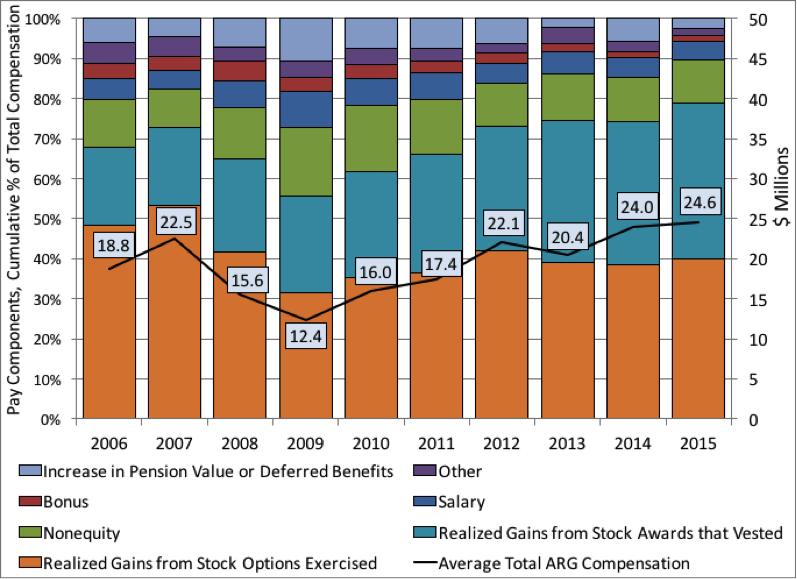
Figure 1: Average total compensation and cumulative percentage shares of pay components, 500 highest-paid U.S.-based CEOs in each year, ranked by total ARG compensation, 2006-2015 Source: Authors’ calculations using the S&P ExecuComp database (retrieved March 16, 2017)
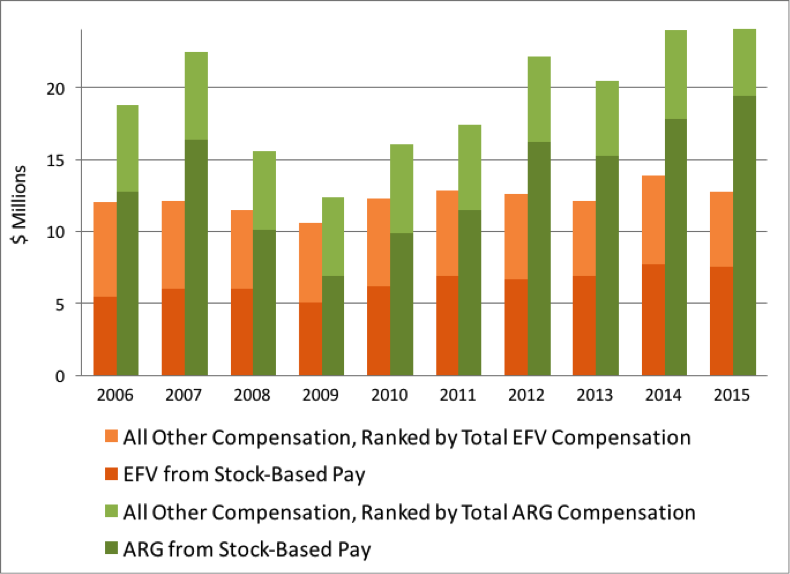
Figure 2: Comparison of total average ARG and total average EFV compensation of the 500 highest-paid U.S.-based CEOs in each year, ranked by total ARG compensation, 2006-2015 Source: Authors’ calculations using the S&P ExecuComp database (retrieved March 16, 2017)
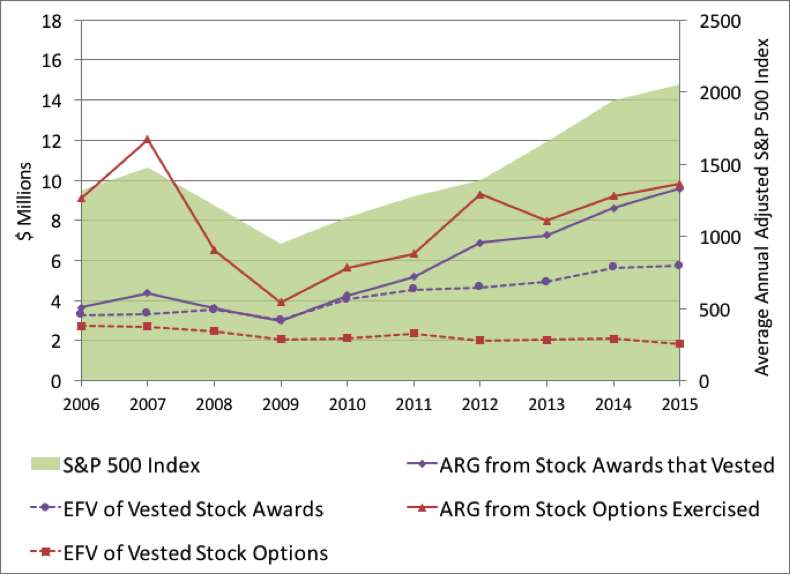
Figure 3: ARG from stock options and stock awards compared with EFV of stock options and stock awards, 500 highest-paid U.S.-based CEOs in each year, ranked by total ARG compensation, 2006-2015 Source: Authors’ calculations using the S&P ExecuComp database (retrieved March 16, 2017)
Here is an example, albeit an extreme one, of the difference that the use of the correct ARG measure can make. If the PRDR had been in force in 2014 and 2015, Gilead Sciences, a pharmaceutical company that has been under Congressional investigation for price gouging,[16] would have recorded CEO total EFV compensation of about $19 million each year in calculating the CMW ratio. The actual money-in-the-bank total ARG compensation of its CEO John C. Martin was, however, $193 million in 2014 and $232 million in 2015. The $38 million in pay attributed to Martin over the two years would have been fiction; the $425 million in pay that he took home is fact—and Gilead’s actual CMW ratio would have been ten to twelve times the ratio that the SEC PRDR would have required Gilead to report.[17]
So we know what CEOs actually make from stock-based pay. Yet virtually everyone, including not only the SEC in its PRDR but also labor unions,[18] progressive think tanks,[19] and the media,[20] uses EFV measures. Why? As we explain in our report “The Mismeasure of Mammon: Uses and Abuses of Executive Pay Data,” since 2006 the SEC has privileged the EFV numbers in the Summary Compensation Table of proxy statements, requiring that the EFV measure be used to calculate total annual compensation of the named executives. Hence these EFV measures are the government-approved numbers used by almost anyone interested in current levels of executive compensation. The ARG numbers are reported in a subsidiary table in the proxy statement, where they typically go unnoticed. The SEC could easily fix the problem by placing the ARG facts, instead of the EFV fictions, in the Summary Compensation Table. Or, using Standard & Poor’s ExecuComp database as we have done, analysts who are aware of what is fact and what is fiction could calculate total executive compensation using the valid ARG variables for stock options and stock awards.[21]
ARG pay and the legalized looting of the U.S. business corporation
That includes the SEC itself, which, in this regard, has been since 2006 the purveyor of EFV measures that we should start labelling “fake news.” The PRDR is a good idea. But it must be based on the actual, not fictitious, pay of CEOs as well as a standard for determining median-worker pay that is consistent across companies. And it should be recognized in implementing the PRDR that it is the kind of information that the public should have been getting from companies some four decades ago, before extreme income inequality had become an economic plague.
[1] “SEC Adopts Rule for Pay Ratio Disclosure,” Securities and Exchange Commission press release, August 5, 2015, at https://www.sec.gov/news/pressrelease/2015-160.html.
[2] U.S. Congress, Dodd-Frank Wall Street Reform and Consumer Protection Act, January 5, 2010, H.R. 4173—529, referring to section 229.402(c)(2)(x) of title 17, Code of Federal Regulations, at https://www.law.cornell.edu/cfr/text/17/229.402.
[3] Acting Chairman Michael S. Piwowar, “Reconsideration of Pay Ratio Rule Implementation,” Securities and Exchange Commission public statement, February 7, 2017, at https://www.sec.gov/news/statement/reconsideration-of-pay-ratio-rule-implementation.html.
[4] William Lazonick, Sustainable Prosperity in the New Economy? Business Organization and High-Tech Employment in the United States, Upjohn Institute for Employment, Research, 2009.
[5] William Lazonick, “Labor in the Twenty-First Century: The Top 0.1% and the Disappearing Middle Class,” in Christian E. Weller, ed., Inequality, Uncertainty, and Opportunity: The Varied and Growing Role of Finance in Labor Relations, Cornell University Press, 2015: 143-192.
[6] For 964 companies with 10,000 or more employees in 2012, these shares were nine percent of establishments, 28 percent of employees, 31 percent of payrolls, and 36 percent of revenues. United States Census Bureau, “Statistics of U.S. Businesses (SUSB),” Data on “2012 SUSB Annual Data Tables by Establishment Industry” at https://www.census.gov/data/tables/2012/econ/susb/2012-susb-annual.html. The most recent data for 2014 (which do not include revenues) show that 1,986 firms with 5,000 or more employees and 994 firms with 10,000 or more employees had slightly larger shares of establishments, employees, and payrolls than the largest firms in 2012: https://www.census.gov/data/tables/2014/econ/susb/2014-susb-annual.html.
[7] “The World Wealth and Income Database: http://topincomes.parisschoolofeconomics.eu/#Database: United States, Top 0.1% income composition.
[8] William Lazonick, “The Value-Extracting CEO: How Executive Stock-Based Pay Undermines Investment in Productive Capabilities,” Institute for New Economic Thinking Working Paper No. 54, December 4, 2016, at https://www.ineteconomics.org/research/research-papers/the-value-extracting-ceo-how-executive-stock-based-pay-undermines-investment-in-productive-capabilities.
[9] Matt Hopkins and William Lazonick, “The Mismeasure of Mammon: The Uses and Abuses of Executive Pay Data,” Institute for New Economic Thinking Working Paper No. 49, at https://www.ineteconomics.org/research/research-papers/the-mismeasure-of-mammon-uses-and-abuses-of-executive-pay-data; William Lazonick and Matt Hopkins, “Corporate executives are making way more money than anyone reports,” The Atlantic, September 15, 2016, at http://www.theatlantic.com/business/archive/2016/09/executives-making-way-more-than-reported/499850/; William Lazonick and Matt Hopkins, “If the SEC measured CEO pay packages properly, they would look even more outrageous,” Harvard Business Review Blog, December 22, 2016, at https://hbr.org/2016/12/if-the-sec-measured-ceo-pay-packages-properly-they-would-look-even-more-outrageous.
[10] “SEC Adopts Rule for Pay Ratio Disclosure”
[11] Gretchen Morgenson, “Portland adopts surcharge on CEO pay in move versus income inequality,” New York Times, December 7, 2016, at https://www.nytimes.com/2016/12/07/business/economy/portland-oregon-tax-executive-pay.html.
[12] Graef S. Crystal, In Search of Excess: The Overcompensation of the American Executive, Norton, 1991. See also Roberto S. Ferdman, “The pay gap between CEOs and workers is much worse than you realize,” Washington Post, September 25, 2014.
[13] Drucker Institute, “Turning up the heat on executive pay,” press release, February 17, 2011.
[14] William Lazonick, “Profits Without Prosperity: Stock Buybacks Manipulate the Market and Leave Most Americans Worse Off,” Harvard Business Review, September 2014, 46-55, at https://hbr.org/2014/09/profits-without-prosperity; Lazonick, “The Value-Extracting CEO.”
[15] Ibid.
[16] United States Senate Committee on Finance, “Wyden-Grassley Sovaldi Investigation Finds Revenue-Driven Pricing Strategy Behind $84,000 Hepatitis Drug,” press release, December 1, 2015, at https://www.finance.senate.gov/ranking-members-news/wyden-grassley-sovaldi-investigation-finds-revenue-driven-pricing-strategy-behind-84-000-hepatitis-drug.
[17] More generally, for executive pay in the U.S. pharmaceutical industry, see William Lazonick, Matt Hopkins, Ken Jacobson, Mustafa Erdem Sakinç, and Öner Tulum, “U.S. Pharma’s Business Model: Why It Is Broken, and How It Can Be Fixed,” in David Tyfield, Rebecca Lave, Samuel Randalls, and Charles Thorpe, eds., The Routledge Handbook of the Political Economy of Science, Routledge, 2017.
[18] AFL-CIO Executive Paywatch, at http://http://www.aflcio.org/Corporate-Watch/Paywatch-2016/Corporat…
[19] Sarah Anderson, “Historic CEO pay tax proposal passes in Portland,” Institute for Policy Studies, December 15, 2016, at http://www.ips-dc.org/historic-ceo-pay-tax-proposal-passes-portland/.
[20] David Gelles, “Top CEO pay fell—yes, fell—in 2015,” New York Times, May 27, 2016, at https://www.nytimes.com/2016/05/29/business/top-ceo-pay-fell-yes-fell-in-2015.html?_r=0.
[21] Hopkins and Lazonick, “The Mismeasure of Mammon.”
[22] See Lazonick, “Labor in the Twenty-First Century.”
[23] Lazonick, “Profits Without Prosperity”; Lazonick, “The Value-Extracting CEO.”
[24] Lazonick, “Profits Without Prosperity”; William Lazonick, “Stock Buybacks: From Retain-and-Reinvest to Downsize-and-Distribute,” Center for Effective Public Management, Brookings Institution, April 2015, pp. 10-11, at http://www.brookings.edu/research/papers/2015/04/17-stock-buybacks-lazonick.
[25] Lazonick, “Labor in the Twenty-First Century.”